The hardware and bandwidth for this mirror is donated by METANET, the Webhosting and Full Service-Cloud Provider.
If you wish to report a bug, or if you are interested in having us mirror your free-software or open-source project, please feel free to contact us at mirror[@]metanet.ch.
![]()

GHRexplore is an R package for exploratory analysis of temporal and spatio-temporal health data including case counts, incidence rates, and covariates. It provides commonly used visualizations and supports standard data transformations such as temporal and spatial aggregations. The package also offers extensive customization options for the resulting figures. Currently available plotting functions include:
plot_timeseries: Plots time series of covariates, case
counts or incidence rates.plot_timeseries2: Plots time series of two covariates,
case counts or incidence rates using a dual-axis plot.plot_heatmap: Plots a time series of covariates, case
counts or incidence rates as heatmaps.plot_seasonality: Plots yearly time series to detect
seasonal patterns of covariates, case counts or incidence rates.plot_correlation: Plots a correlation matrix of a
series of variables.plot_map: Plots a choropleth map of covariates, case
counts or incidence rates.plot_bivariate: Plots a bivariate plot of two numerical
and/or categorical variables.plot_multiple, plot_combine and
plot_compare: Used to generate graphs of several variables
at the same time.epiyw_to_date and date_to_epiyw: Functions
to convert between dates and epidemiological year-weeks for any day of
the week.GHRexplore is one of the packages developed by the Global Health Resilience (GHR) team at the Barcelona Supercomputing Center (BSC) within the IDExtremes project. GHRexplore is the starting point for building INLA models for inference and forecasting of health impacts. It is complemented by the GHRmodel package, which is used to define, fit, and assess the models, and by GHRpredict, which focuses on generating out-of-sample predictions, conducting cross-validation analyses, and evaluating predictive performance. More information about the toolkit and an online version of the package documentation can be found at the GHR tools website.
# Install from CRAN
install.packages("GHRexplore")

# Get the development version from Gitlab
devtools::install_git('https://earth.bsc.es/gitlab/ghr/ghrexplore.git')library("GHRexplore")
# Use data included in the package to plot a heatmap with spatial aggregation
data("dengue_MS")
plot_heatmap(data = dengue_MS,
var = "dengue_cases",
type = "inc",
pop = "population",
time = "date",
area = "micro_code",
aggregate_space = "meso_code",
transform = "log10p1",
title = "Dengue incidence in Brazil") 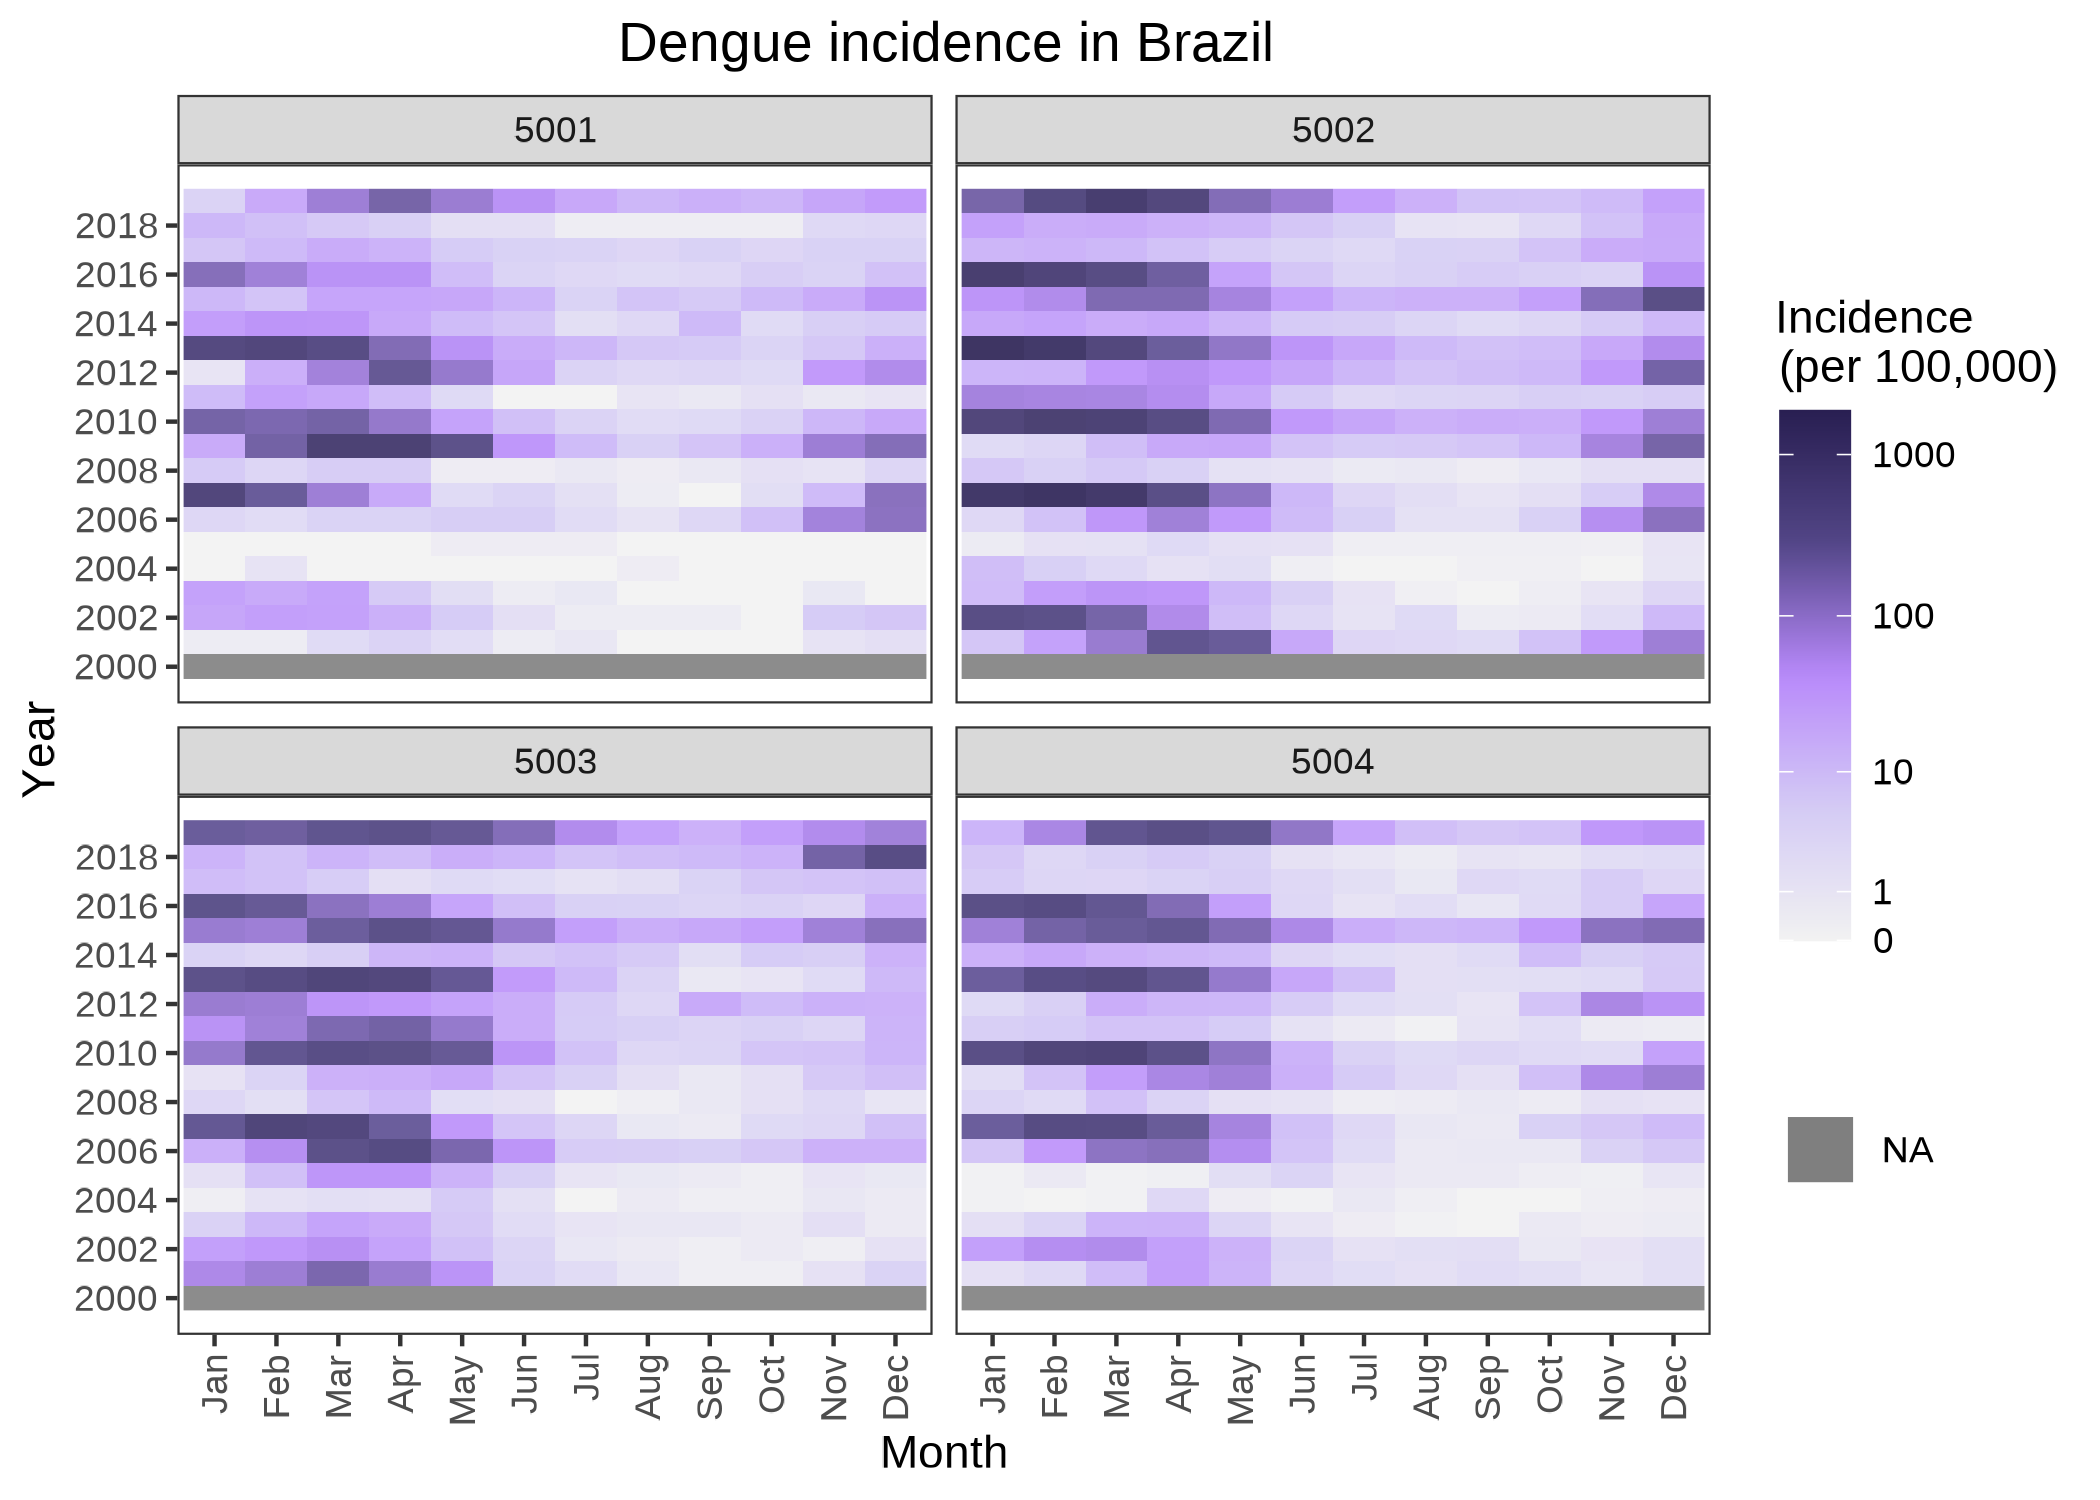
Giovenale
Moirano, PhD

Barcelona Supercomputing Center
Global Health Resilience
Carles Milà,
PhD
Barcelona Supercomputing Center
Global Health Resilience
Anna B.
Kawiecki, PhD
Barcelona Supercomputing Center
Global Health Resilience
Rachel Lowe,
PhD
Barcelona Supercomputing Center
Global Health Resilience (Group leader)
These binaries (installable software) and packages are in development.
They may not be fully stable and should be used with caution. We make no claims about them.