The hardware and bandwidth for this mirror is donated by METANET, the Webhosting and Full Service-Cloud Provider.
If you wish to report a bug, or if you are interested in having us mirror your free-software or open-source project, please feel free to contact us at mirror[@]metanet.ch.
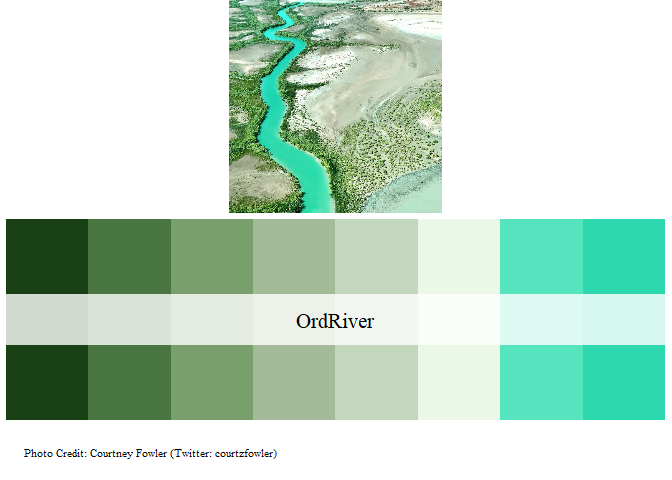
Code and general idea inspired by the “Wes Anderson Palettes” R-Package.
citation('LimnoPalettes')##
## To cite package 'LimnoPalettes' in publications use:
##
## Paul Julian (2020). LimnoPalettes: A Limnology Themed Palette
## Generator. R package version 0.1.0.
## https://github.com/SwampThingPaul/LimnoPalettes
##
## A BibTeX entry for LaTeX users is
##
## @Manual{,
## title = {LimnoPalettes: A Limnology Themed Palette Generator},
## author = {Paul Julian},
## year = {2020},
## note = {R package version 0.1.0},
## url = {https://github.com/SwampThingPaul/LimnoPalettes},
## }install.packages("devtools");# if you do not have it installed on your PC
devtools::install_github("SwampThingPaul/LimnoPalettes")
set.seed(1)
dat = data.frame(Group=c(rep("A",10),rep("B",10),rep("C",10),rep("D",10)),
var1=rnorm(40),var2=runif(40,1,15),var3=rpois(40,3))
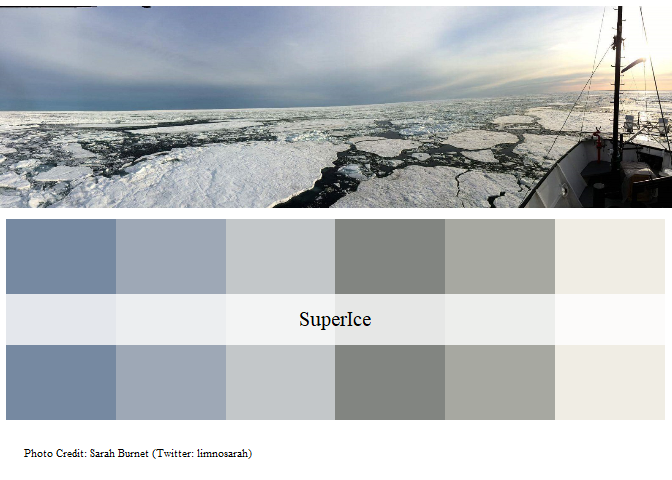
cols = limno_palette("SuperIce",4)
boxplot(var2~Group,dat, col=cols)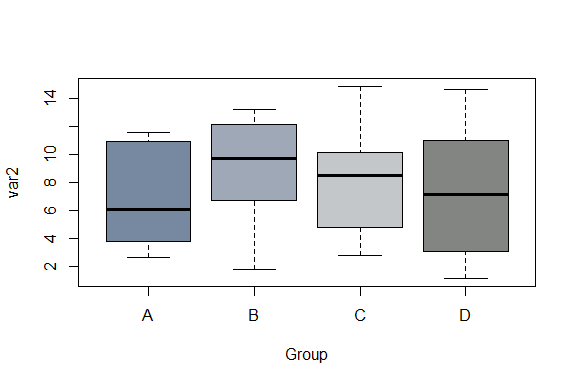
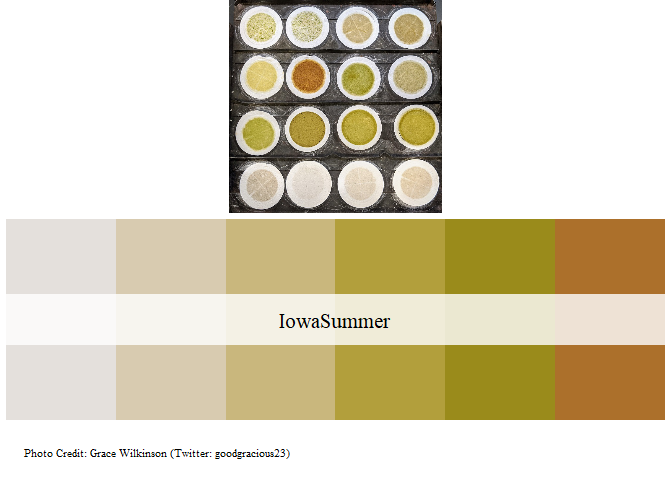
cols = limno_palette("IowaSummer",4,"continuous")
cols2 = cols[dat$Group]
plot(var2~var3,dat,pch=21,bg=cols2,cex=2)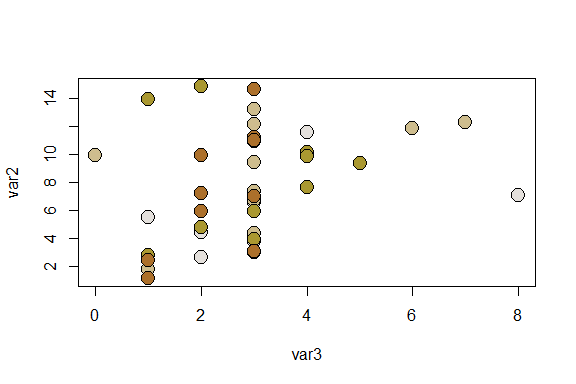
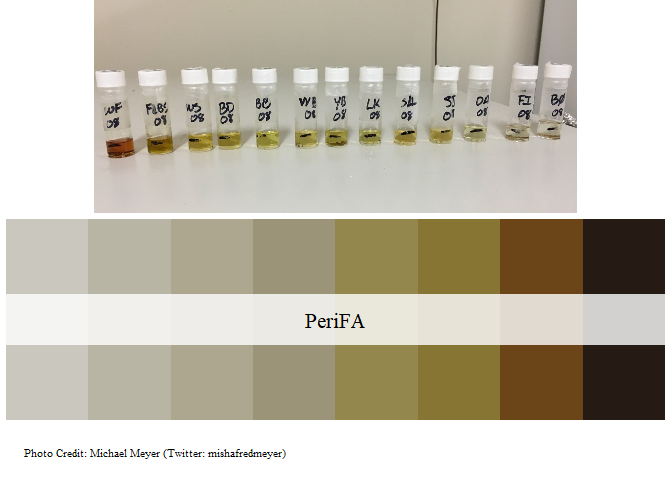
cols = limno_palette("PeriFA",4,"continuous")
barplot(aggregate(dat$var3,list(dat$Group),mean)$x,names.arg=unique(dat$Group),ylim=c(0,4),col=cols)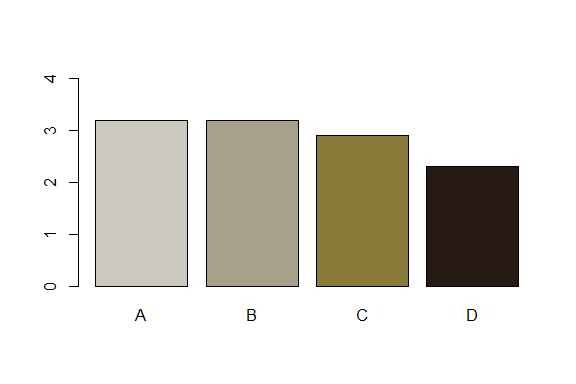
While not a part of this package, for data visualization purposes it would be a good idea to see how these colors are perceived for people with color blindness.
library(colorBlindness)
mat = matrix(1:81, nrow = 9, ncol = 9)

library(ggplot2)
library(reshape2)
cols = limno_palette("IowaSummer")

mat1 = melt(t(mat[9:1, ]))
len = length(cols)-1
mat1$v2 = cut(mat1$value,
              breaks = seq(0,ceiling(81/len)*len,
                           length.out = len+1))
ht = ggplot(mat1) +
  geom_tile(aes(x=Var1, y=Var2, fill=v2)) +
  scale_fill_manual(values=cols) +
  theme_bw()

# check the plot by CVD simulator
cvdPlot(ht)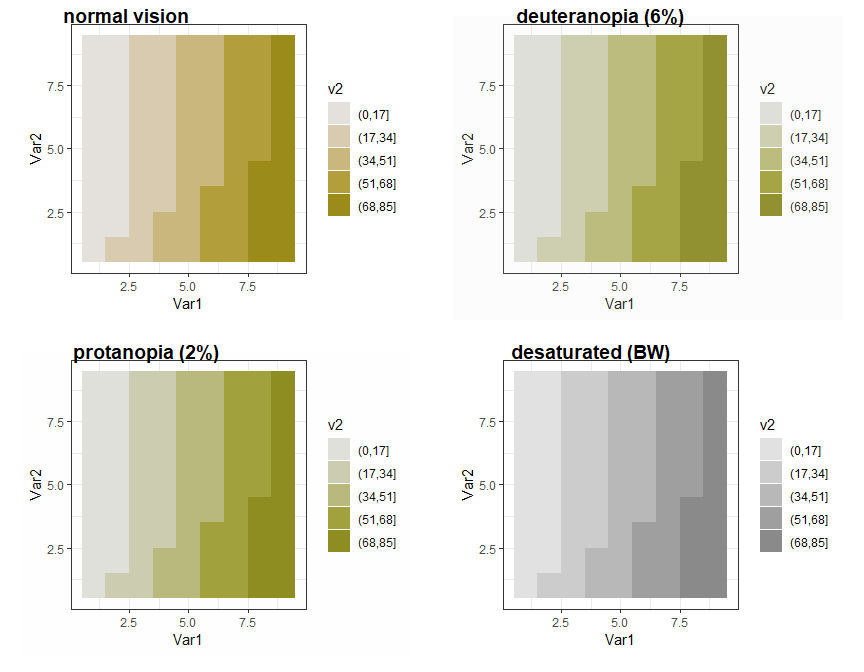
# Second Example
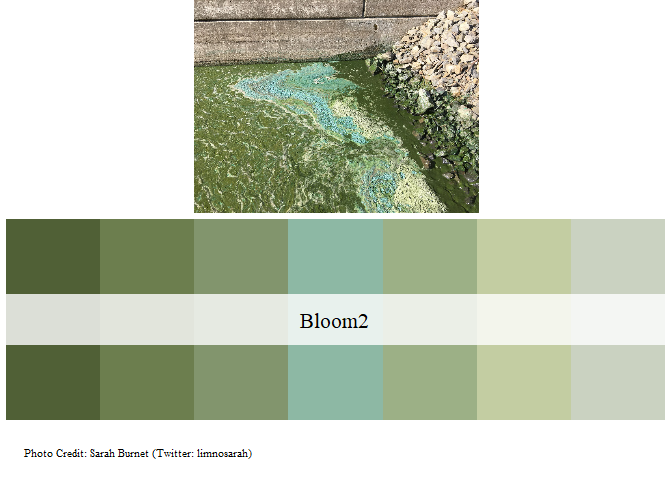
cols = limno_palette("Bloom2",10, "continuous")
mat1 = melt(t(mat[9:1, ]))
len = length(cols)-1
mat1$v2 = cut(mat1$value,
breaks = seq(0,ceiling(81/len)*len,
length.out = len+1))
ht = ggplot(mat1) +
geom_tile(aes(x=Var1, y=Var2, fill=v2)) +
scale_fill_manual(values=cols) +
theme_bw()
# check the plot by CVD simulator
cvdPlot(ht)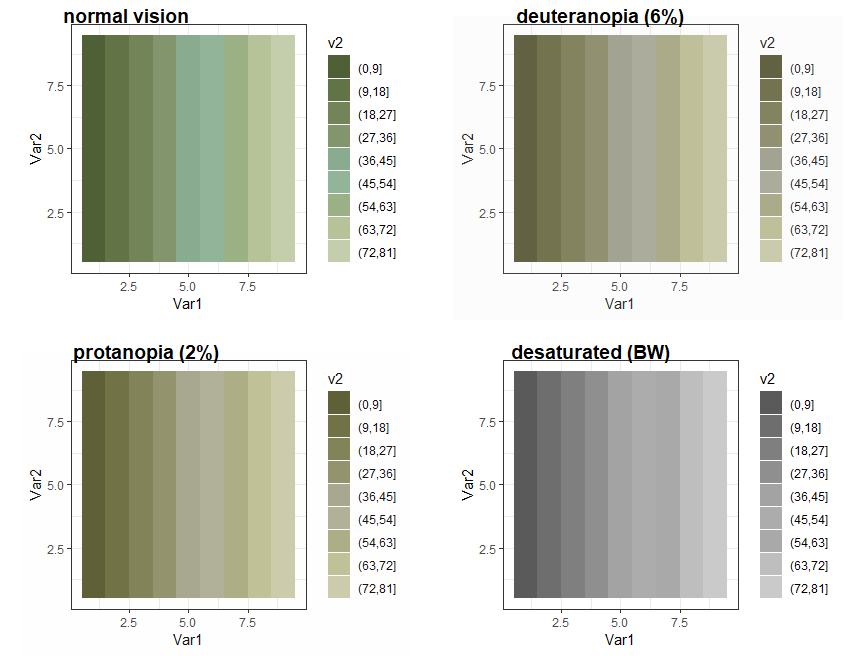
These binaries (installable software) and packages are in development.
They may not be fully stable and should be used with caution. We make no claims about them.