The hardware and bandwidth for this mirror is donated by METANET, the Webhosting and Full Service-Cloud Provider.
If you wish to report a bug, or if you are interested in having us mirror your free-software or open-source project, please feel free to contact us at mirror[@]metanet.ch.


![]()
This R package (Hahsler, Piekenbrock, and Doran 2019) provides a fast C++ (re)implementation of several density-based algorithms with a focus on the DBSCAN family for clustering spatial data. The package includes:
Clustering
Outlier Detection
Cluster Evaluation
Fast Nearest-Neighbor Search (using kd-trees)
The implementations use the kd-tree data structure (from library ANN)
for faster k-nearest neighbor search, and are for Euclidean distance
typically faster than the native R implementations (e.g., dbscan in
package fpc), or the implementations in WEKA, ELKI and Python’s scikit-learn.
The following R packages use dbscan: AnimalSequences,
bioregion, clayringsmiletus,
CLONETv2, clusterWebApp,
cordillera,
CPC, crosshap, crownsegmentr,
CspStandSegmentation,
daltoolbox,
DataSimilarity,
diceR, dobin, doc2vec, dPCP, emcAdr, eventstream,
evprof, fastml, FCPS, flowcluster,
funtimes, FuzzyDBScan,
HaploVar, immunaut, karyotapR, ksharp, LLMing, LOMAR, maotai, MapperAlgo, metaCluster,
metasnf, mlr3cluster,
neuroim2, oclust, omicsTools, openSkies, opticskxi, OTclust, outlierensembles,
outlierMBC,
pagoda2, parameters, ParBayesianOptimization,
performance,
PiC, rcrisp, rMultiNet, seriation, sfdep, sfnetworks, sharp, smotefamily,
snap, spdep, spNetwork, ssMRCD, stream, SuperCell, synr, tidySEM, VBphenoR, VIProDesign,
weird
To cite package ‘dbscan’ in publications use:
Hahsler M, Piekenbrock M, Doran D (2019). “dbscan: Fast Density-Based Clustering with R.” Journal of Statistical Software, 91(1), 1-30. doi:10.18637/jss.v091.i01 https://doi.org/10.18637/jss.v091.i01.
@Article{,
  title = {{dbscan}: Fast Density-Based Clustering with {R}},
  author = {Michael Hahsler and Matthew Piekenbrock and Derek Doran},
  journal = {Journal of Statistical Software},
  year = {2019},
  volume = {91},
  number = {1},
  pages = {1--30},
  doi = {10.18637/jss.v091.i01},
}Stable CRAN version: Install from within R with
install.packages("dbscan")Current development version: Install from r-universe.
install.packages("dbscan",
    repos = c("https://mhahsler.r-universe.dev",
"https://cloud.r-project.org/"))Load the package and use the numeric variables in the iris dataset
library("dbscan")

data("iris")
x <- as.matrix(iris[, 1:4])
DBSCAN
db <- dbscan(x, eps = 0.42, minPts = 5)
db
## DBSCAN clustering for 150 objects.
## Parameters: eps = 0.42, minPts = 5
## Using euclidean distances and borderpoints = TRUE
## The clustering contains 3 cluster(s) and 29 noise points.
##
## 0 1 2 3
## 29 48 37 36
##
## Available fields: cluster, eps, minPts, metric, borderPointsVisualize the resulting clustering (noise points are shown in black).
pairs(x, col = db$cluster + 1L)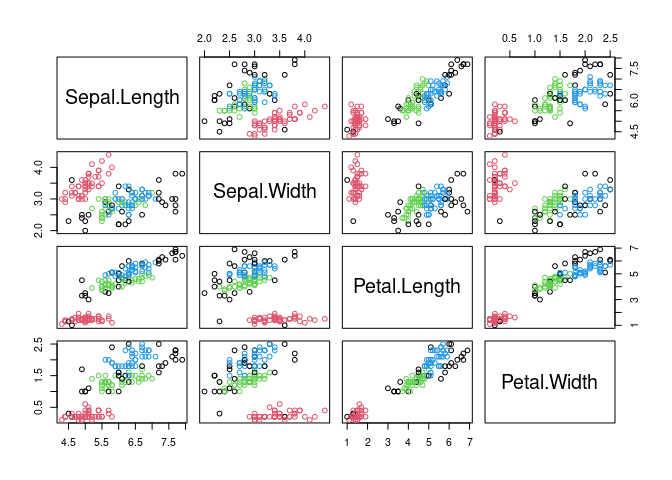
OPTICS
opt <- optics(x, eps = 1, minPts = 4)
opt
## OPTICS ordering/clustering for 150 objects.
## Parameters: minPts = 4, eps = 1, eps_cl = NA, xi = NA
## Available fields: order, reachdist, coredist, predecessor, minPts, eps,
## eps_cl, xiExtract DBSCAN-like clustering from OPTICS and create a reachability plot (extracted DBSCAN clusters at eps_cl=.4 are colored)
opt <- extractDBSCAN(opt, eps_cl = 0.4)
plot(opt)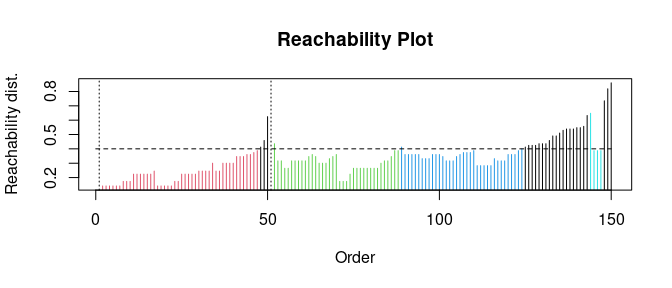
HDBSCAN
hdb <- hdbscan(x, minPts = 4)
hdb
## HDBSCAN clustering for 150 objects.
## Parameters: minPts = 4
## The clustering contains 2 cluster(s) and 0 noise points.
##
## 1 2
## 100 50
##
## Available fields: cluster, minPts, coredist, cluster_scores,
## membership_prob, outlier_scores, hcVisualize the hierarchical clustering as a simplified tree. HDBSCAN finds 2 stable clusters.
plot(hdb, show_flat = TRUE)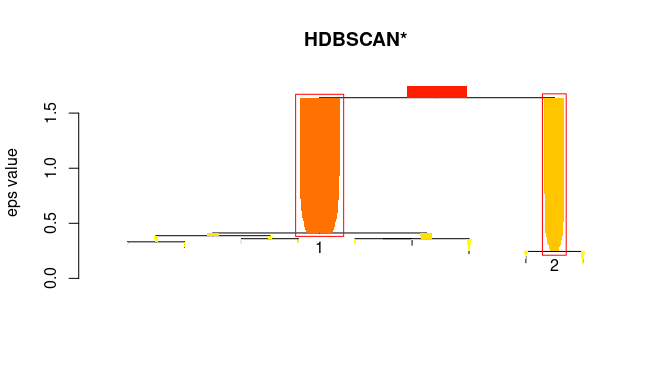
dbscan provides for all clustering algorithms
tidy(), augment(), and glance()
so they can be easily used with tidyverse, ggplot2 and tidymodels.
library(tidyverse)
db <- x %>%
    dbscan(eps = 0.42, minPts = 5)
Get cluster statistics as a tibble
tidy(db)## # A tibble: 4 × 3
## cluster size noise
## <fct> <int> <lgl>
## 1 0 29 TRUE
## 2 1 48 FALSE
## 3 2 37 FALSE
## 4 3 36 FALSEVisualize the clustering with ggplot2 (use an x for noise points)
augment(db, x) %>%
    ggplot(aes(x = Petal.Length, y = Petal.Width)) + geom_point(aes(color = .cluster,
    shape = noise)) + scale_shape_manual(values = c(19, 4))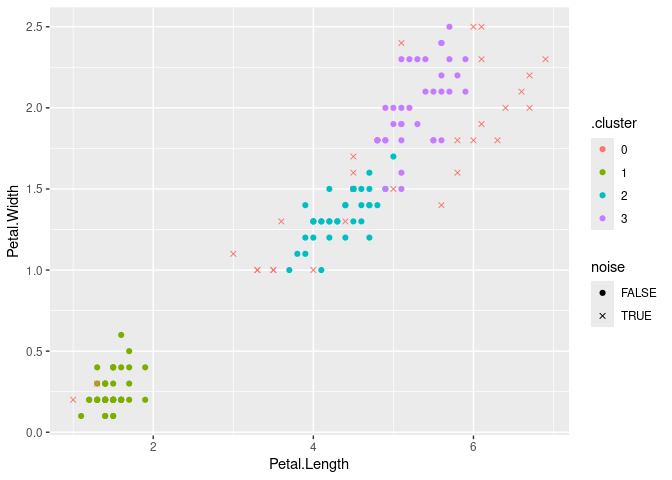
R, the R package dbscan, and the Python package
rpy2 need to be installed.
import pandas as pd
import numpy as np

### prepare data
iris = pd.read_csv('https://archive.ics.uci.edu/ml/machine-learning-databases/iris/iris.data',
                   header = None,
                   names = ['SepalLength', 'SepalWidth', 'PetalLength', 'PetalWidth', 'Species'])
iris_numeric = iris[['SepalLength', 'SepalWidth', 'PetalLength', 'PetalWidth']]

# get R dbscan package
from rpy2.robjects import packages
dbscan = packages.importr('dbscan')

# enable automatic conversion of pandas dataframes to R dataframes
from rpy2.robjects import pandas2ri
pandas2ri.activate()

db = dbscan.dbscan(iris_numeric, eps = 0.5, MinPts = 5)
print(db)
## DBSCAN clustering for 150 objects.
## Parameters: eps = 0.5, minPts = 5
## Using euclidean distances and borderpoints = TRUE
## The clustering contains 2 cluster(s) and 17 noise points.
##
## 0 1 2
## 17 49 84
##
## Available fields: cluster, eps, minPts, dist, borderPoints# get the cluster assignment vector
labels = np.array(db.rx('cluster'))
labels## array([[1, 1, 1, 1, 1, 1, 1, 1, 1, 1, 1, 1, 1, 1, 1, 1, 1, 1, 1, 1, 1, 1,
## 1, 1, 1, 1, 1, 1, 1, 1, 1, 1, 1, 1, 1, 1, 1, 1, 1, 1, 1, 0, 1, 1,
## 1, 1, 1, 1, 1, 1, 2, 2, 2, 2, 2, 2, 2, 0, 2, 2, 0, 2, 2, 2, 2, 2,
## 2, 2, 0, 2, 2, 2, 2, 2, 2, 2, 2, 2, 2, 2, 2, 2, 2, 2, 2, 2, 2, 0,
## 2, 2, 2, 2, 2, 0, 2, 2, 2, 2, 0, 2, 2, 2, 2, 2, 2, 0, 0, 2, 0, 0,
## 2, 2, 2, 2, 2, 2, 2, 0, 0, 2, 2, 2, 0, 2, 2, 2, 2, 2, 2, 2, 2, 0,
## 2, 2, 0, 0, 2, 2, 2, 2, 2, 2, 2, 2, 2, 2, 2, 2, 2, 2]],
## dtype=int32)The dbscan package is licensed under the GNU General Public License (GPL) Version 3. The OPTICSXi R implementation was directly ported from the ELKI framework’s Java implementation (GNU AGPLv3), with permission by the original author, Erich Schubert.
These binaries (installable software) and packages are in development.
They may not be fully stable and should be used with caution. We make no claims about them.