
The hardware and bandwidth for this mirror is donated by METANET, the Webhosting and Full Service-Cloud Provider.
If you wish to report a bug, or if you are interested in having us mirror your free-software or open-source project, please feel free to contact us at mirror[@]metanet.ch.
An interactive, ultra-responsive, and high-fidelity data explorer widget for clinical programming (CDISC SDTM/ADaM) and general R data frames, built on a virtualized React grid backend.


dtsmartr is a premium, Kaggle-style data browser package for R. Leveraging a virtualized React rendering engine and a custom Base64 Apache Arrow IPC serialization pipeline, it delivers instantaneous rendering and fluid scrolling on tables containing millions of cells—directly inside the RStudio/Positron Viewer pane, embedded in Shiny, or exported as offline-capable HTML reports.
For step-by-step installation guides, API reference sheets, and feature articles, visit our official documentation site: 👉 https://wagh-nikhil.github.io/dtsmartr/
Depending on the scale of your dataset and analytical needs,
dtsmartr offers two tailored frontend engines:
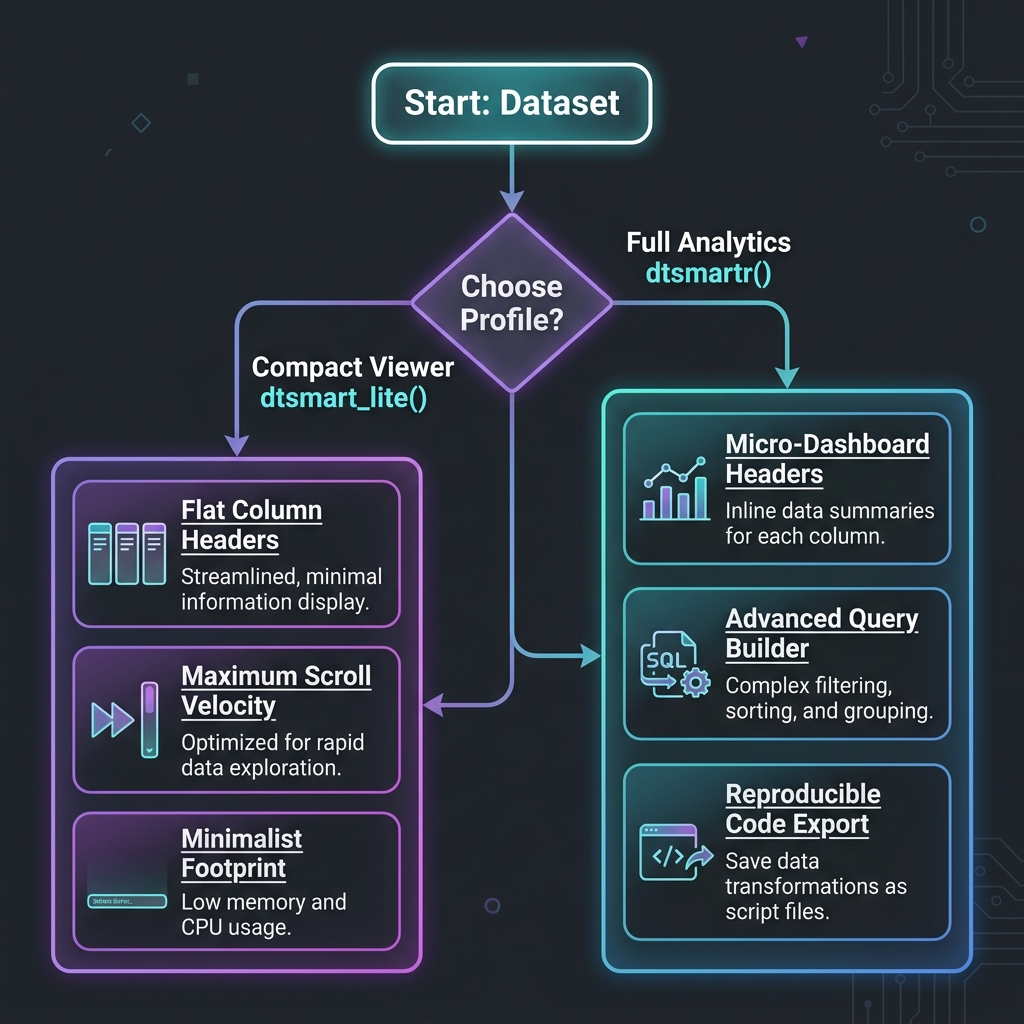
dtsmartr()
— Full Analytics Mode (Default)Enables the complete suite of analytical features, designed for deep
exploration: * Micro-Dashboard Headers: Live
histograms, stacked categorical bars, and data completeness progress
bars. * Insights Drawer: Interactive SVG distribution
histograms and Pareto charts. * Query Builder:
Multi-rule, nested Boolean logic filters (AND/OR). * Code
Export: Code generation for Base R, dplyr, SQL,
and Apache Arrow.
dtsmart_lite() — Minimalist Viewer ModeForces a compact, ultra-clean grid layout optimized for raw scrolling performance and minimal memory footprint: * Flat Headers: Hides distributions, progress bars, and stats from column headers to maximize visible grid space. * Analytics Disabled: Hides the Advanced Query Builder, Insights Drawer, and Code Export controls. * High Refresh Rate: Streamlines the DOM footprint to ensure maximum scrolling velocity on huge data structures.
≡ Min / ≡ Auto /
≡ Detail) and row padding (Compact /
Standard / Comfort) directly in the toolbar.
Row height scales dynamically (24px → 32px → 40px), doubling screen
layout capacity. Density modes can also be configured programmatically
from R.🔒 Constant, ⚖️ CV) or binary
stacked bars instead of full histograms to maximize screen estate.1️⃣ ↑, 2️⃣ ↓) and a toolbar sort chain
display.?
to open the overlay cheatsheet modal. Shortcuts include
Ctrl+Alt+F for filter, Ctrl+Shift+[ /
] for density, and Ctrl+Shift+F to clear.3px solid #3b82f6) along the frozen boundary
across the header and all body cells.⇅) from quick-filter popovers (≡) on header
cards to prevent accidental clicks.# for numeric,
a for character, L for logical,
📅 for date-time).label attributes (highly common in
CDISC SDTM/ADaM datasets) and renders them as clear sub-headers.df[df$AGE > 50 & df$SEX == "F", ]df %>% filter(AGE > 50, SEX == "F")SELECT * FROM df WHERE AGE > 50 AND SEX = 'F'df |> filter(AGE > 50) |> collect()dtsmart_launch() Data Ingestion
Wizard: Start a local uploader wizard to drag-and-drop local
Excel, CSV, RDS, or SAS (.sas7bdat) files directly into the
grid.Our serialization protocol is engineered for speed. In version
0.3.0, dtsmartr transitioned to a high-speed
Apache Arrow IPC Binary Stream Serialization
pipeline:
[R Data Frame]
    │
    ▼  (Apache Arrow C++ Engine)
[Arrow RecordBatch Stream]
    │
    ▼  (base64enc C-Library)
[Base64 Arrow IPC Payload] ---> Written directly into the HTMLWidget structure
                                    │
                                    ▼ (React App on Page Load)
                                [Uint8Array Decode]
                                    │
                                    ▼ (apache-arrow JS Library)
                                [Arrow Columnar Table]
                                    │
                                    ▼
[Virtualized Grid View]Install the package directly from GitHub using
remotes:
# Install remotes if needed
if (!requireNamespace("remotes", quietly = TRUE)) {
  install.packages("remotes")
}

# Install the latest dev version
remotes::install_github("wagh-nikhil/dtsmartr")Fire up the grid on standard datasets in one line:
library(dtsmartr)

# 1. Full Analytics Mode (Default)
dtsmartr(mtcars)

# 2. Minimalist Viewer Mode (Clean, compact layout)
dtsmart_lite(iris, title = "Iris Compact View")

# 3. Custom configurations (Dark theme, pre-hidden variables)
dtsmartr(
  data = mtcars,
  options = dtsmartr_options(
    theme = "dark",
    hidden_columns = c("cyl", "hp"),
    na_string = "Missing"
  )
)Licensed under the MIT License.
These binaries (installable software) and packages are in development.
They may not be fully stable and should be used with caution. We make no claims about them.