The hardware and bandwidth for this mirror is donated by METANET, the Webhosting and Full Service-Cloud Provider.
If you wish to report a bug, or if you are interested in having us mirror your free-software or open-source project, please feel free to contact us at mirror[@]metanet.ch.
ggisotonic introduces a ggplot layer
stat_isotonic to add isotonic or monotonic regression
curves similar to ggplot2::geom_smooth.
install.packages("ggisotonic")
library("ggisotonic")
You can install the released version of ggisotonic from github with:
remotes::install_github("talegari/ggisotonic")library("ggplot2")
set.seed(100)
dataset = data.frame(x = sort(runif(1e2)),
y = c(rnorm(1e2/2), rnorm(1e2/2, mean = 4)),
w = sample(1:3, 1e2, replace = TRUE)
)
print(head(dataset))
#> x y w
#> 1 0.03014575 -0.4470622 3
#> 2 0.03780258 -1.7385979 2
#> 3 0.05638315 0.1788648 2
#> 4 0.09151028 1.8974657 3
#> 5 0.12348723 -2.2719255 3
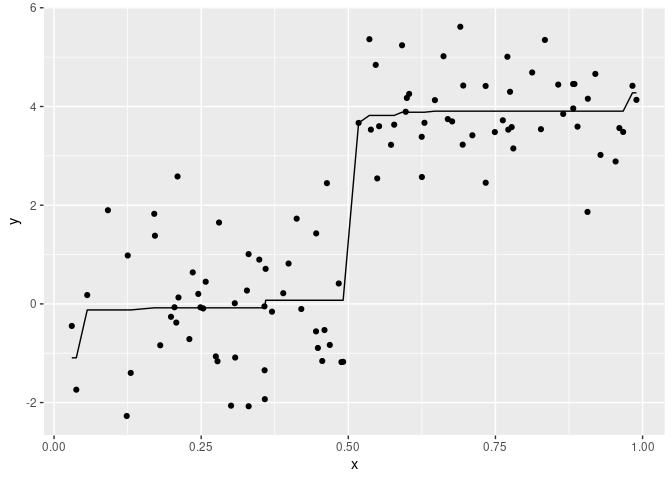
#> 6 0.12523909 0.9804641 2# plot isotonic regression line
ggplot(dataset, aes(x = x, y = y)) +
geom_point() +
stat_isotonic()
# plot weighted isotonic regression line along with facets
ggplot(dataset, aes(x = x, y = y)) +
   geom_point() +
   stat_isotonic(aes(w = w), color = 'red', size = 1.5, show.legend = FALSE) +
   facet_wrap(w ~ .)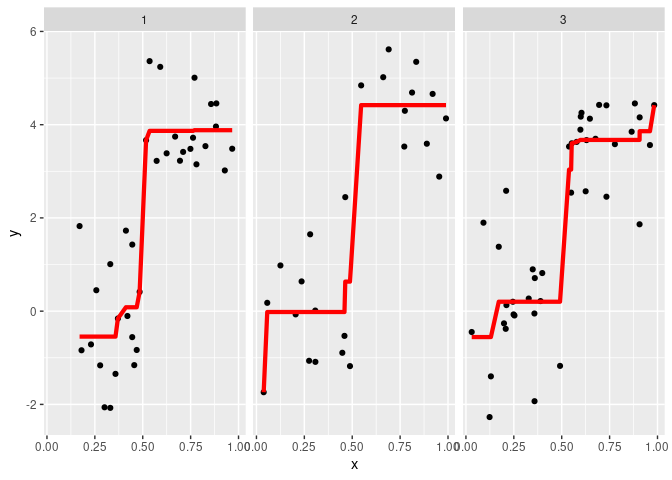
These binaries (installable software) and packages are in development.
They may not be fully stable and should be used with caution. We make no claims about them.