The hardware and bandwidth for this mirror is donated by METANET, the Webhosting and Full Service-Cloud Provider.
If you wish to report a bug, or if you are interested in having us mirror your free-software or open-source project, please feel free to contact us at mirror[@]metanet.ch.




Grammar-native, hand-drawn geoms for ggplot2 - the rough.js sketch aesthetic in pure R, with no JavaScript and no browser.
ggsketch gives you ggplot2 geoms
(geom_sketch_col(), geom_sketch_line(),
geom_sketch_point(), …) that render with a wobbly,
hand-drawn look: roughened double-stroke outlines and hachure /
cross-hatch / zigzag / dots / dashed fills. It even shades by
tonal engraving — continuous tone built from hatch-line
density, the way an etcher or banknote engraver works
(geom_sketch_engrave()), something the fill-pattern
packages can’t do because they tile a motif rather than compute tone.
Because the geoms are real grid grobs wrapped in ggproto,
they compose with aes(), stats, scales, facets, and coords,
and draw correctly on every R graphics device — screen,
PNG, PDF, and SVG.
| ggsketch | ggrough | |
|---|---|---|
| Approach | Native ggplot2 geoms (grid grobs) | Post-hoc convert a finished plot to SVG, redraw in HTML Canvas |
| Output | Any device: screen / PNG / PDF / SVG | HTML widget only (breaks static PDF/PNG) |
Composes with aes() / stats / scales / facets |
Yes | No (operates on the rendered plot) |
| JavaScript / browser | None | Requires rough.js in a browser |
| Status | Active | Maintainer marks it dormant (“doesn’t work with recent releases of ggplot2”) |
The ggrough maintainer himself notes that “a nice way to
create sketchy visualisations would be a neat addition to the {ggplot2}
ecosystem.” ggsketch fills that gap with native geoms.
# install.packages("pak")
pak::pak("orijitghosh/ggsketch")
ggsketch is pure R (NeedsCompilation: no);
its only hard dependencies are ggplot2, grid, rlang, scales, cli, and
withr.
Full documentation and a gallery of every geom: https://orijitghosh.github.io/ggsketch/.
library(ggplot2)
library(ggsketch)

df <- data.frame(product = c("Alpha","Bravo","Charlie","Delta"),
                 units   = c(34, 51, 22, 47))

ggplot(df, aes(product, units)) +
  geom_sketch_col(fill = "#7BAFD4", seed = 1L) +
  labs(title = "Units sold") +
  theme_sketch()
Every randomized routine is seeded, so a given seed
always produces the same wobble — your plots are reproducible. Set a
session-wide default with options(ggsketch.seed = 1L).
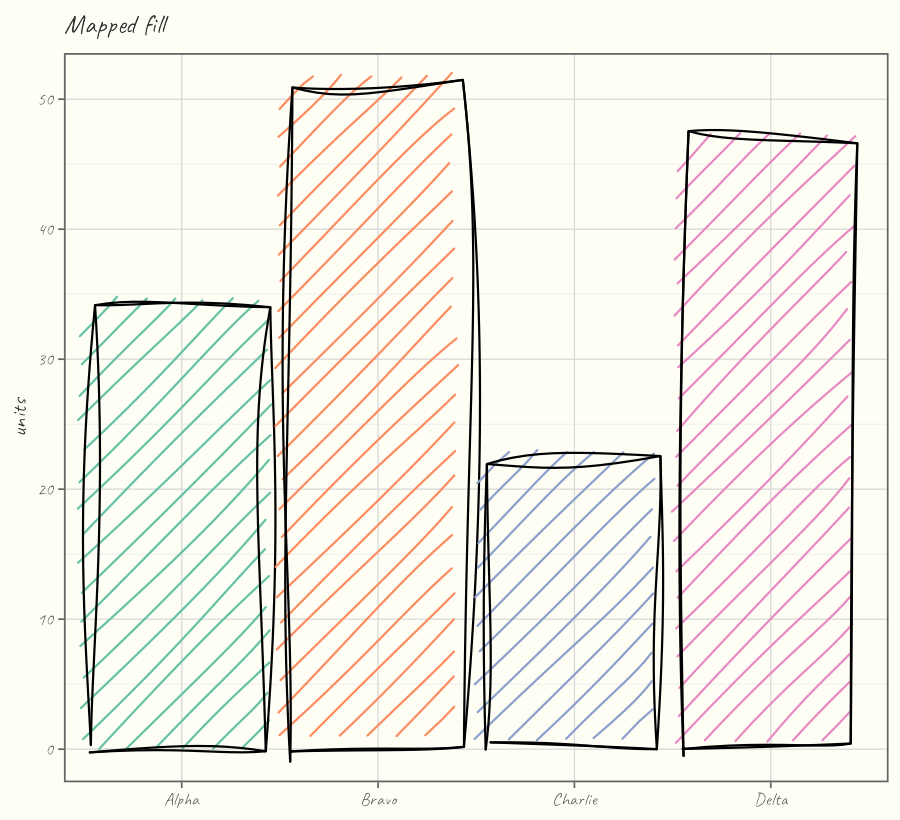
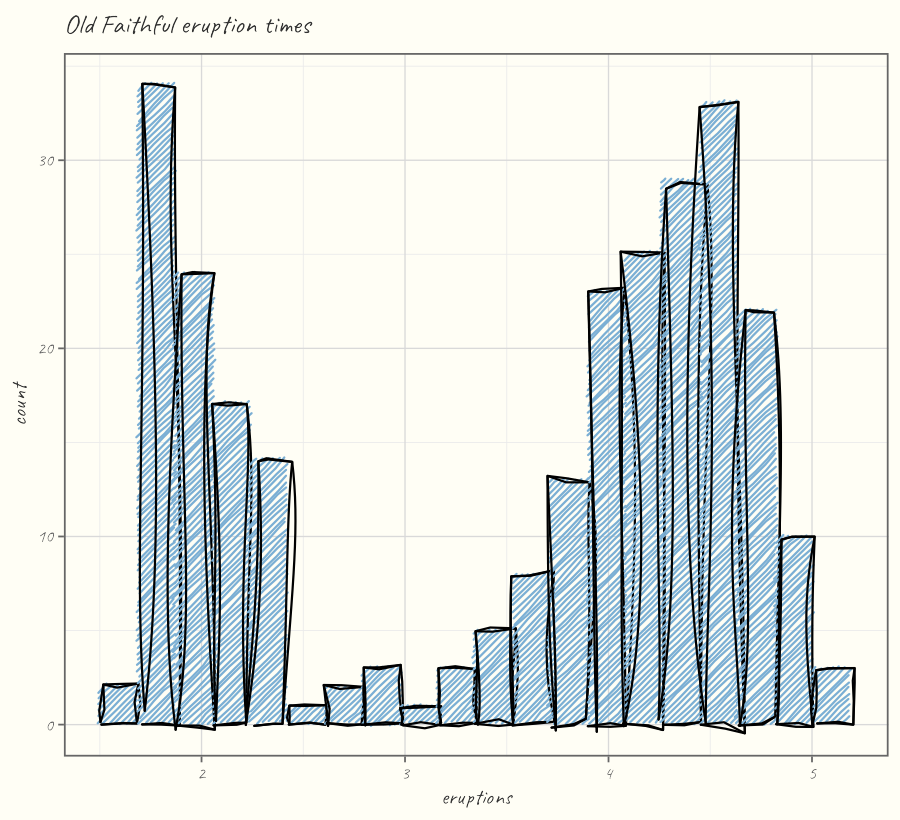
Discrete fills map straight through aes(fill = …), and
any geom accepts a stat - roughened columns coloured by a Brewer
palette, and an Old Faithful histogram:
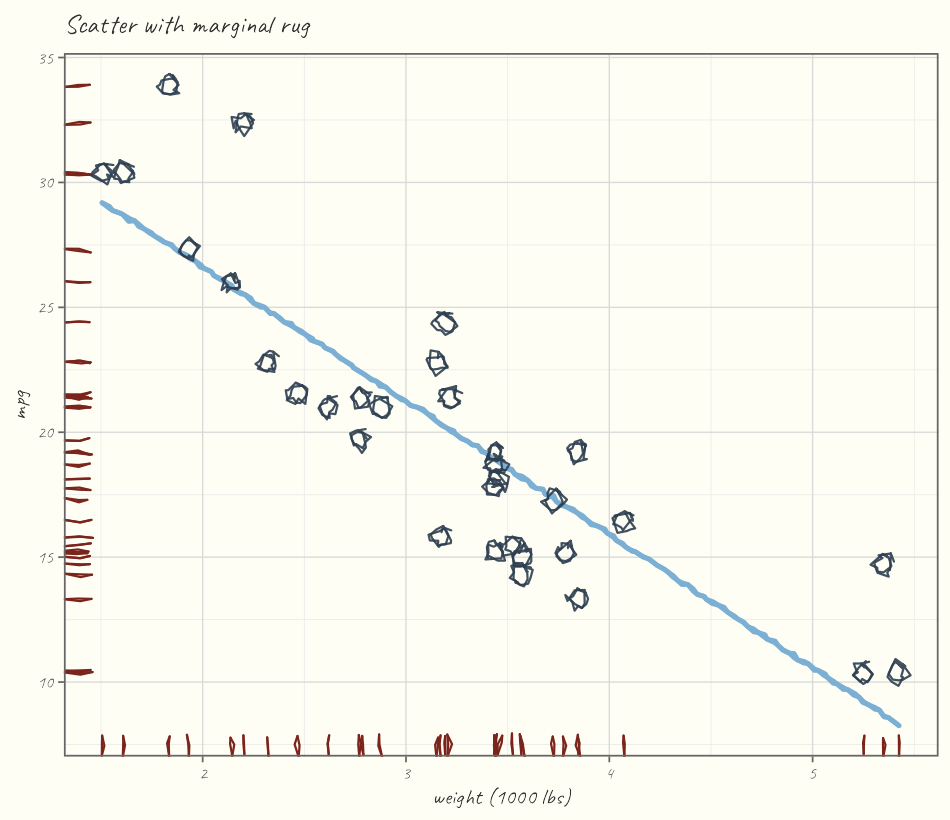
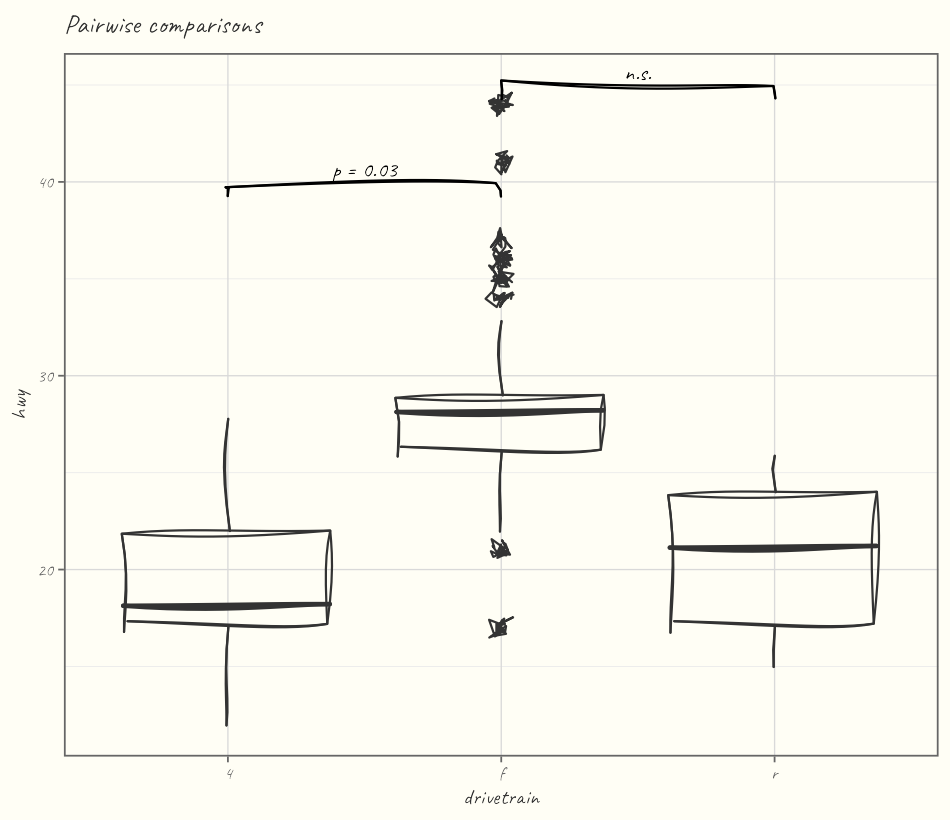
Points, a marginal rug, and a hand-drawn linear fit compose like any
other layers; geom_sketch_bracket() adds significance
brackets for pairwise comparisons:
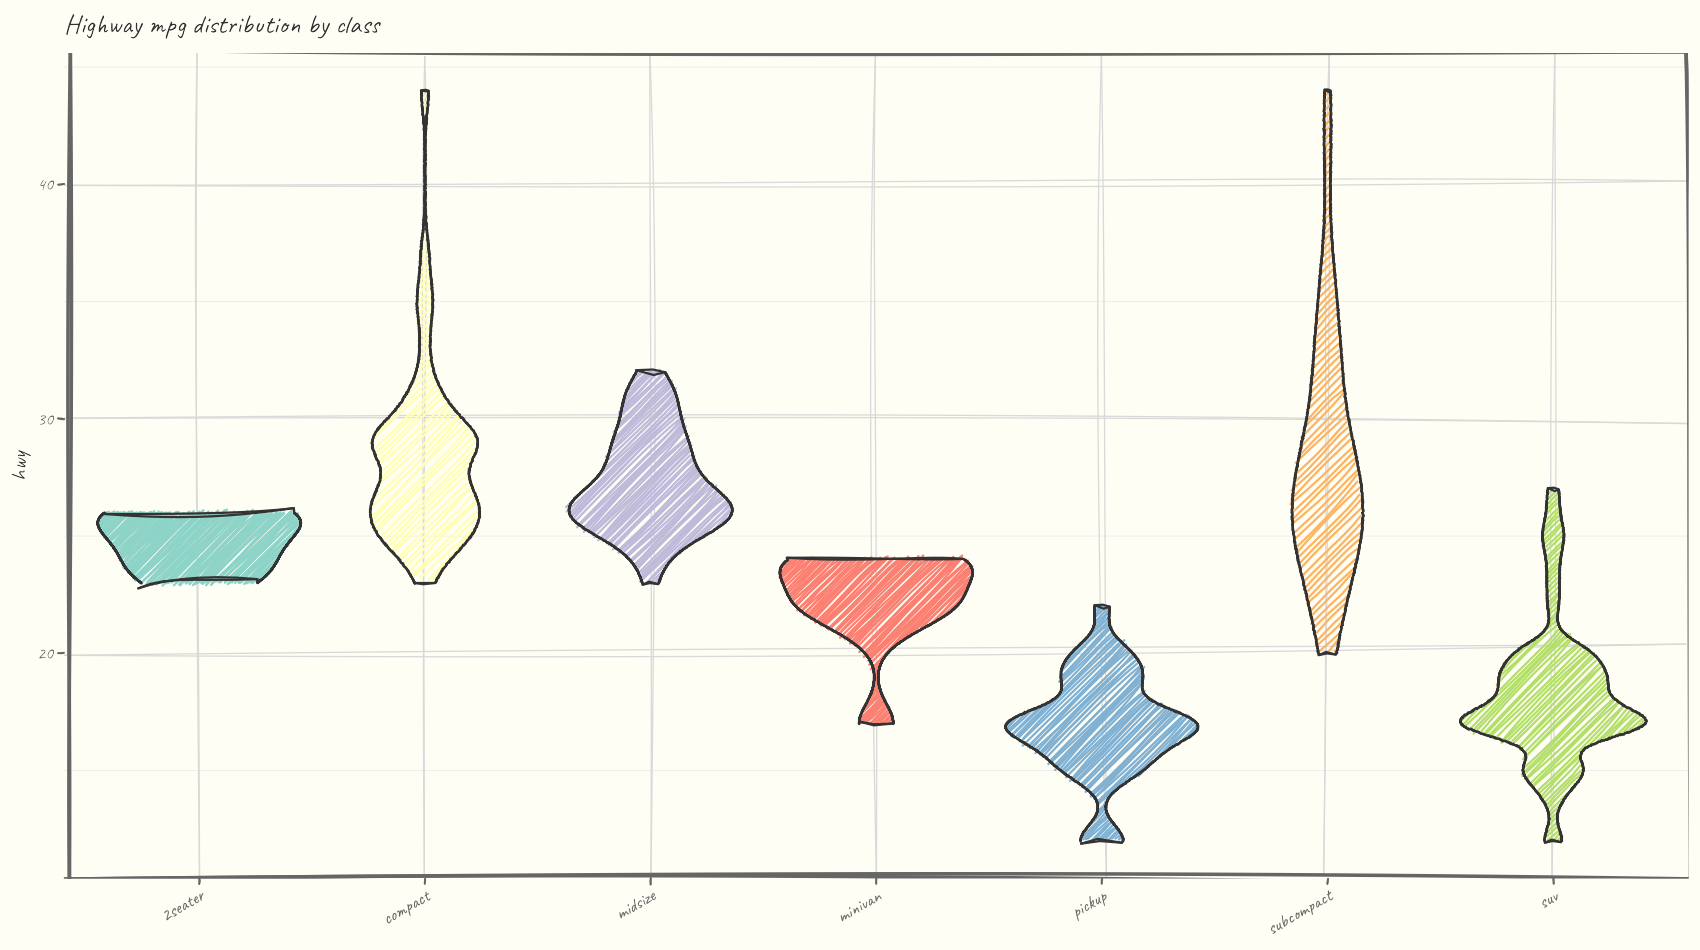
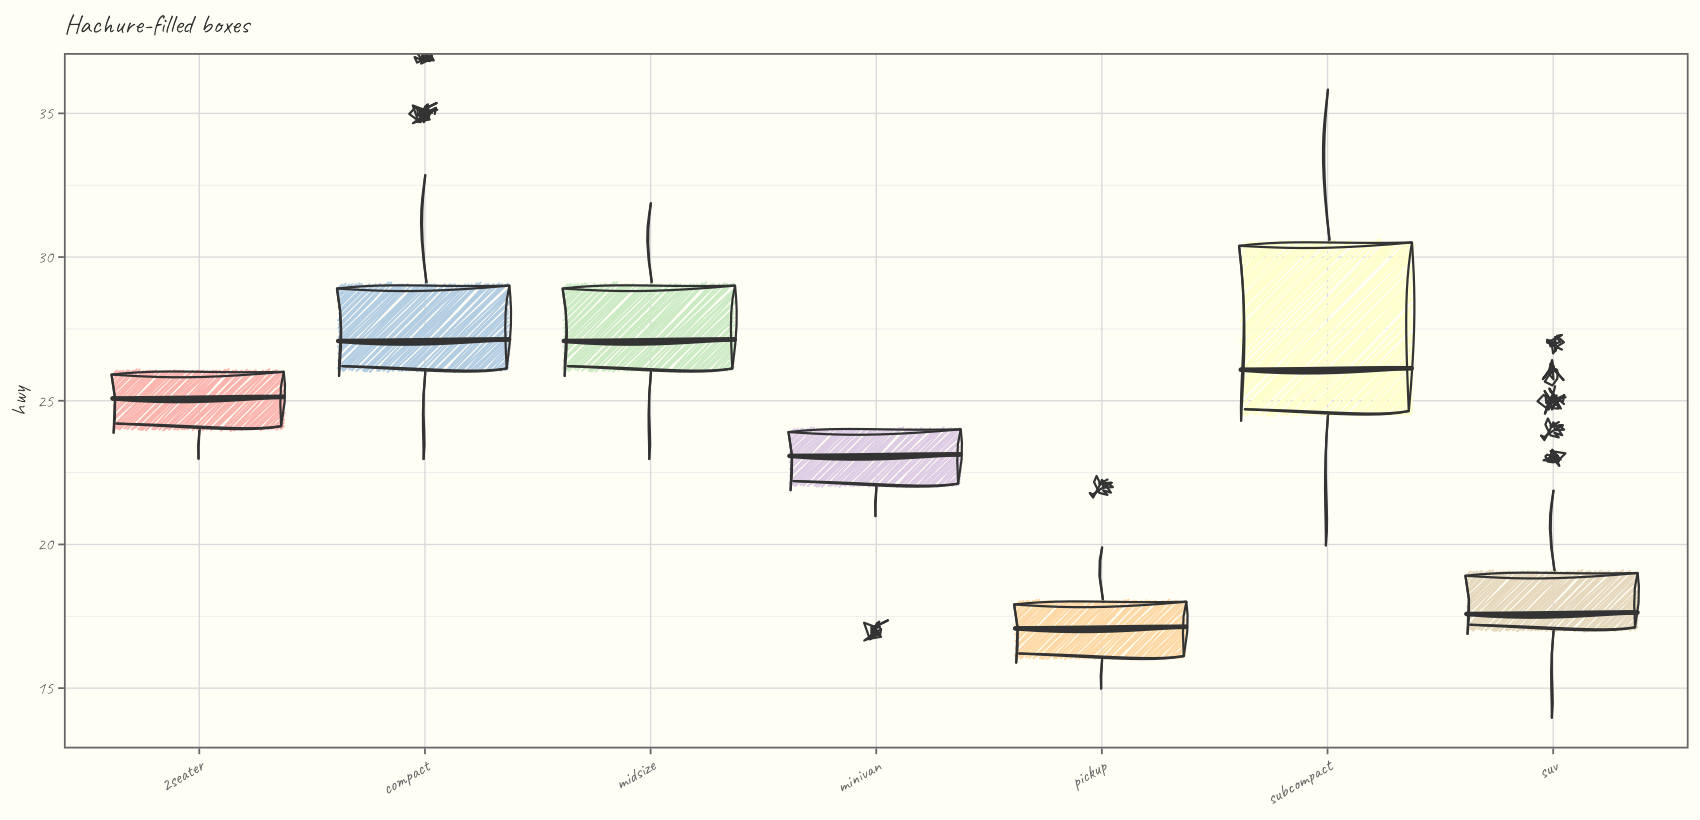
Every fill style works on every filled geom - here
fill_style = "hachure" boxplots across vehicle classes:
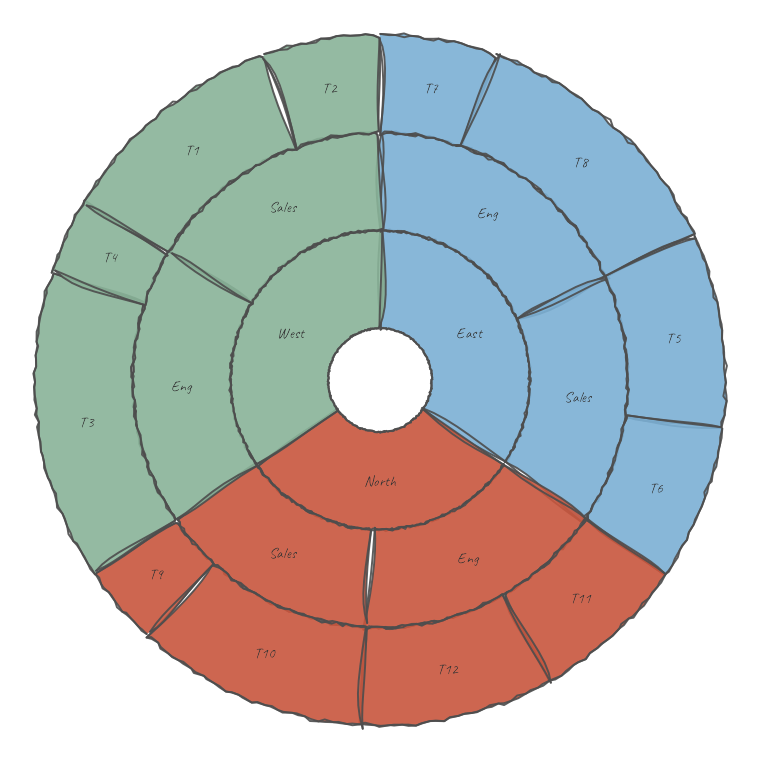
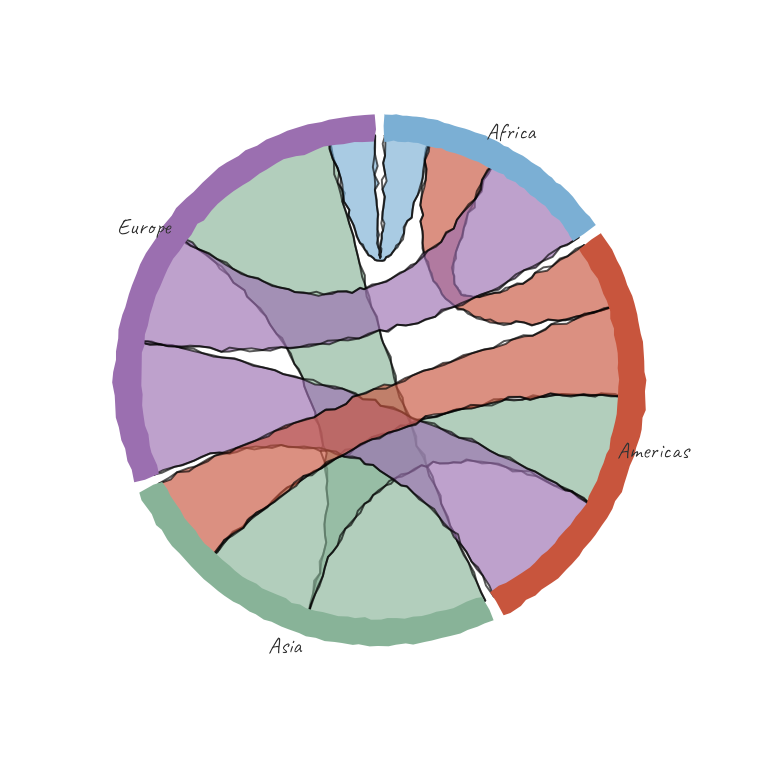
The 2.0 line adds whole chart families that compose with
+ — here a hierarchy as a hand-drawn sunburst, and weighted
flows as a chord diagram:
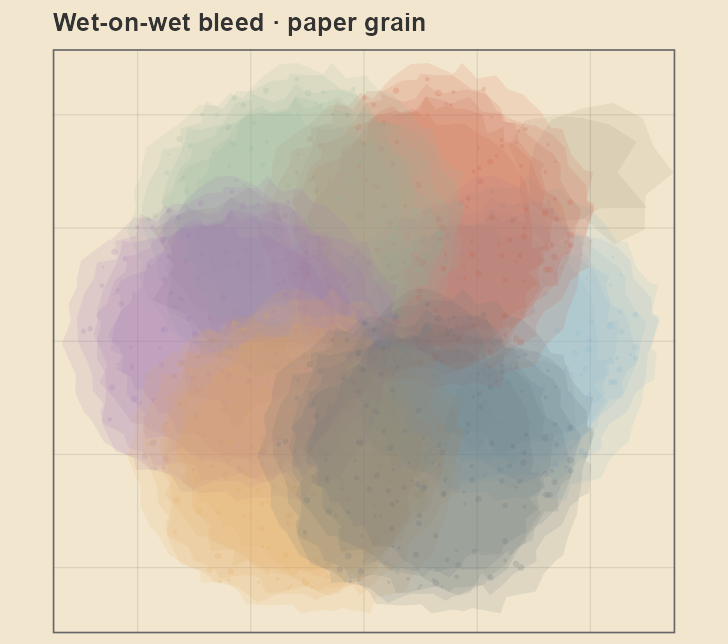
It also simulates the medium, not just the line. The
"watercolor" fill paints translucent washes that bleed
wet-on-wet where regions overlap — mingling into new colours — and
feather along the paper tooth set by
theme_sketch(paper = ):
| Family | Geoms |
|---|---|
| Lines & points | geom_sketch_line(), geom_sketch_path(),
geom_sketch_point() |
| Bars & tiles | geom_sketch_col(), geom_sketch_bar(),
geom_sketch_rect(), geom_sketch_tile(),
geom_sketch_lollipop() |
| Areas & curves | geom_sketch_polygon(),
geom_sketch_ribbon(), geom_sketch_area(),
geom_sketch_density(),
geom_sketch_smooth() |
| Distributions | geom_sketch_histogram(),
geom_sketch_violin(), geom_sketch_boxplot(),
geom_sketch_beeswarm(),
geom_sketch_ridgeline(),
geom_sketch_dotplot(), geom_sketch_ecdf() |
| Comparisons & change | geom_sketch_dumbbell(),
geom_sketch_slope(), geom_sketch_bump(),
geom_sketch_waterfall(), geom_sketch_funnel(),
geom_sketch_pyramid() |
| Circular & composed | geom_sketch_circle(),
geom_sketch_ellipse(), geom_sketch_segment(),
geom_sketch_step() |
| Engraving & tone | geom_sketch_engrave() (shade an
x/y/z surface by hatch-line
density), geom_sketch_shade() (aes(tone = …)
value → density), scale_engrave() |
| Charts & diagrams | geom_sketch_pie(), geom_sketch_waffle(),
geom_sketch_treemap(), geom_sketch_sunburst(),
geom_sketch_radar(), geom_sketch_chord(),
geom_sketch_arc_diagram(),
geom_sketch_alluvial(),
geom_sketch_parallel(), geom_sketch_mosaic(),
geom_sketch_marimekko(), geom_sketch_rose(),
geom_sketch_calendar(), geom_sketch_gantt(),
geom_sketch_dendrogram() |
| Networks & maps | geom_sketch_edge() / sketch_graph()
(force-directed layout, no graph dep), geom_sketch_sf()
(hand-drawn simple-features maps) |
| Motion | animate_sketch() (boiling-line shimmer or draw-on
reveal → GIF) |
| Helpers & annotation | annotate_sketch(), geom_sketch_bracket()
(significance brackets), annotate_sketch_arrow() /
annotate_sketch_callout() (content-aware pointers),
annotate_sketch_highlight() /
annotate_sketch_underline() (marker emphasis),
geom_sketch_text_repel() (non-overlapping labels),
theme_sketch(), sketch_style() (one-call style
presets), ggsketch_save() |
| Frame & scales | element_sketch_line(),
element_sketch_rect() (via
theme_sketch(rough_frame = TRUE)),
coord_sketch() / coord_sketch_polar(),
scale_colour_sketch(), scale_fill_sketch(),
scale_medium_discrete() (mappable drawing media),
register_sketch_font() |
| Parameter | Meaning |
|---|---|
roughness |
How far points are jittered (0 = ruler-straight, ~1 default, >3 loose) |
bowing |
How much segments bow outward |
n_passes |
Overlaid strokes (2 = the classic “double stroke”) |
seed |
Integer for reproducible wobble |
fill_style |
"hachure", "cross_hatch",
"zigzag", "zigzag_line",
"scribble", "dots", "dashed",
"stipple", "pencil_shade",
"solid", "watercolor" |
hachure_angle, hachure_gap,
fill_weight |
Fill line angle, spacing, and weight |
Three layers, kept strictly separate:
R/core-*.R):
numbers → numbers. Seeded roughening, ellipse/Bézier sampling, and an
Active-Edge-Table scan-line hachure filler that handles
concave polygons. No grid, no ggplot2.R/grob-*.R):
makeContent() converts to device inches and re-roughens at
the real render size, so resizing re-draws cleanly.R/geom-*.R):
standard ggplot2 extension API.Roughening always happens in inch space, so the look is consistent across aspect ratios and devices.
The algorithms are reimplemented in original R from the
published descriptions of the rough.js algorithms (Preet Shihn,
2020) and the hachure approach of Wood et al. No rough.js
source is vendored, copied, or translated, and no JavaScript ships in
this package. See inst/NOTICE.
ggsketch is an independent R package reimplementing the hand-drawn sketch aesthetic from first principles. It is not affiliated with, derived from, or endorsed by the rough.js project, ggrough, or any related JavaScript libraries.
rough.js is © Preet Shihn and licensed MIT. ggsketch is licensed MIT.
These binaries (installable software) and packages are in development.
They may not be fully stable and should be used with caution. We make no claims about them.