
The hardware and bandwidth for this mirror is donated by METANET, the Webhosting and Full Service-Cloud Provider.
If you wish to report a bug, or if you are interested in having us mirror your free-software or open-source project, please feel free to contact us at mirror[@]metanet.ch.



lbugr provides an R interface to the Ladybug Graph Database, a
high-performance, embedded graph database. The package acts as a wrapper
around the official Python ladybug client, using the
reticulate package to bridge the two languages. This allows
you to interact with Ladybug seamlessly within your R environment,
integrating its powerful graph computation capabilities into your
existing data analysis workflows.
The primary goal of lbugr is to provide an idiomatic R
experience for: - Creating and managing Ladybug database instances. -
Executing Cypher queries. - Loading data from and retrieving results
into R data frames and tibbles. - Converting graph query results
directly into R-native graph objects like igraph and
tidygraph.
lbugr requires Python 3.14 or later
with the ladybug package.
Note: Python 3.14+ is required due to fixes in the underlying kuzu database engine that resolve VirtualAlloc memory issues.
You can install the stable version from CRAN:
install.packages("lbugr")Or install the development version from GitHub:
# install.packages("pak")
pak::pak("WickM/lbugr")After installing lbugr, you must install the required
Python packages. You can do this from your R console using
reticulate:
library(lbugr)
reticulate::py_install("ladybug", pip = TRUE)Important: Ensure you have Python 3.14 or later installed. You can verify your Python version with
py -3.14 --version(Windows) orpython3 --version(macOS/Linux).
You can check that all dependencies are correctly installed by running:
check_ladybug_installation()
#> The 'ladybug' Python package is installed and available.Here is a complete example demonstrating how to create a database, define a schema, load data, and run queries.
library(lbugr)
library(igraph)
library(tidygraph)

# 1. Create a database in a temporary directory
db_path <- tempfile()
con <- lb_connection(db_path)

# 2. Define a schema
# Create a 'Person' node table with a STRING name and INT64 age
schema_query_1 <- "CREATE NODE TABLE Person (
  name STRING,
  age INT64,
  PRIMARY KEY (name)
)"
lb_execute(con, schema_query_1)
#>                           result
#> 1 Table Person has been created.

# Create a 'Knows' relationship table
schema_query_2 <- "CREATE REL TABLE Knows(FROM Person TO Person, since INT64)"
lb_execute(con, schema_query_2)
#>                          result
#> 1 Table Knows has been created.

# 3. Load data from R data frames
# Create node data
nodes <- data.frame(
  name = c("Alice", "Bob", "Carol"),
  age = c(30, 40, 50)
)

# Create edge data
edges <- data.frame(
  from_person = c("Alice", "Bob"),
  to_person = c("Bob", "Carol"),
  since = c(2010, 2015)
)

# Use lb_copy_from_df to load the data
lb_copy_from_df(con, nodes, "Person")

names(edges) <- c("FROM", "TO", "since")
lb_copy_from_df(con, edges, "Knows")

# 4. Execute Cypher queries
# Retrieve data as a data frame
query_result <- lb_execute(con, "MATCH (p:Person) RETURN p.name, p.age")
as.data.frame(query_result)
#>   p.name p.age
#> 1  Alice    30
#> 2    Bob    40
#> 3  Carol    50

# 5. Convert graph results to R objects
# The same query result can be converted into different graph formats.
graph_result <- lb_execute(con, "MATCH (a:Person)-[k:Knows]->(b:Person) RETURN a, k, b")

# a) Convert to an igraph object
g_igraph <- as_igraph(graph_result)
print(g_igraph)
#> IGRAPH 92733d3 DN-- 3 2 --
#> + attr: name (v/c), label (v/l), age (v/l)
#> + edges from 92733d3 (vertex names):
#> [1] Person:Alice->Person:Bob   Person:Bob  ->Person:Carol
plot(g_igraph,
     vertex.color = "#dc2626",
     vertex.label.color = "#f3f4f6",
     vertex.label.font = 2,
     edge.color = "#9ca3af",
     edge.arrow.size = 0.8,
     edge.arrow.width = 0.5,
     bg = "#030712",
     main = "lbugr Graph Structure")

# b) Convert to a tidygraph object
g_tidy <- as_tidygraph(graph_result)
print(g_tidy)
#> # A tbl_graph: 6 nodes and 2 edges
#> #
#> # A rooted forest with 4 trees
#> #
#> # Node Data: 6 × 3 (active)
#>   name         label    age
#>   <chr>        <chr>  <int>
#> 1 Person:Alice <NA>      NA
#> 2 Person:Bob   <NA>      NA
#> 3 Person:Carol <NA>      NA
#> 4 Alice        Person    30
#> 5 Bob          Person    40
#> 6 Carol        Person    50
#> #
#> # Edge Data: 2 × 2
#>    from    to
#>   <int> <int>
#> 1     1     2
#> 2     2     3

# 6. Inspecting Query Results
# You can inspect the schema of a query result without converting it to a data frame.
# Get column names
lb_get_column_names(query_result)
#> [1] "p.name" "p.age"

# Get column data types
lb_get_column_data_types(query_result)
#>      p.name       p.age
#> "character"   "integer"

# Get the full schema as a named list
lb_get_schema(query_result)
#>      p.name       p.age
#> "character"   "integer"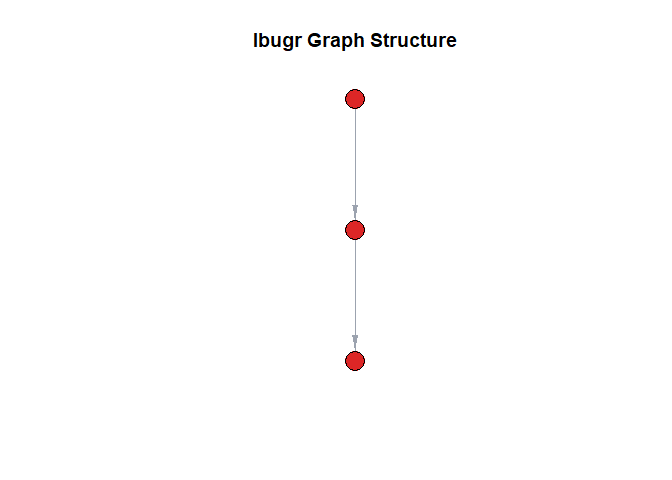
Plot of the graph structure created from Ladybug query results.
These binaries (installable software) and packages are in development.
They may not be fully stable and should be used with caution. We make no claims about them.