
The hardware and bandwidth for this mirror is donated by METANET, the Webhosting and Full Service-Cloud Provider.
If you wish to report a bug, or if you are interested in having us mirror your free-software or open-source project, please feel free to contact us at mirror[@]metanet.ch.

LiNGAM is a method for estimating structural equation models or linear Bayesian networks. It is based on using the non-Gaussianity of the data.
lingamr is a port to R of the LiNGAM package (LiNGAM:
Linear Non-Gaussian Acyclic Model), which is available in Python.
This is currently an alpha version under development, and we are releasing it for the purpose of testing and gathering feedback.
lingam_direct()), with selectable
regression backends (OLS, LASSO, adaptive LASSO, ridge) for
adjacency-matrix estimationlingam_var()) for time series causal
discoverylingam_parce()) and RCD (lingam_rcd())lingam_multi_group()) for
jointly estimating a shared causal order across multiple datasetslingam_high_dim()) for
high-dimensional data (large p, or
p > n)lingam_lim()) for causal discovery on mixed
continuous/binary databootstrap_with_imputation() for causal discovery on
data with missing values, and evaluate_model_fit() for
SEM-based fit evaluation via lavaansummary_lingam()autoplot() (static)tidy() /
glance())This package does not include all the features of the Python version, and it also includes some features that are not present in the Python version.
You can install lingamr from CRAN with:
install.packages("lingamr")Or install the development version from GitHub with:
# install.packages("pak")
pak::pak("morimotoosamu/lingamr")
Some functionality relies on the following suggested packages:
DiagrammeR (interactive plots), igraph and
ggplot2 (static autoplot() graphs and QQ
plots), glmnet (adaptive LASSO), and nortest /
tseries (residual tests).
library(lingamr)

# Generate sample data from a 6-variable LiNGAM model
x <- generate_lingam_sample_6(n = 1000)

# Estimate the causal structure with Direct LiNGAM
model <- lingam_direct(x$data)

# Estimated causal order (as variable names)
colnames(x$data)[model$causal_order]
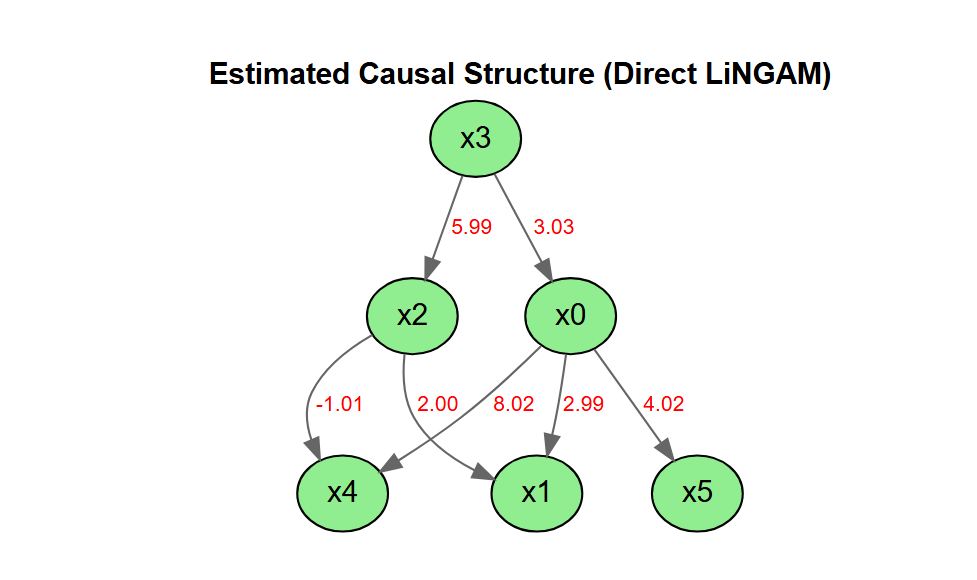
#> [1] "x3" "x2" "x0" "x4" "x5" "x1"
# Visualize the estimated causal graph
model$adjacency_matrix |>
plot_adjacency(
labels = colnames(model$adjacency_matrix),
title = "Estimated Causal Structure (Direct LiNGAM)",
rankdir = "TB",
shape = "ellipse",
fillcolor = "lightgreen"
)
For a full walkthrough — prior knowledge, total causal effects, residual independence and normality tests, and bootstrap (including parallel execution) — see the vignette:
vignette("lingamr")MIT License
Original work: Copyright (c) 2019 T.Ikeuchi, G.Haraoka, M.Ide, W.Kurebayashi, S.Shimizu
Portions of this work: Copyright (c) 2026 O.Morimoto
We thank the following people and organization for their support in developing this package:
Development of this package was assisted by AI coding tools (Google Gemini and Anthropic Claude). The author reviewed, tested, and validated all AI-generated code.
Please submit bug reports and feature requests via GitHub Issues.
These binaries (installable software) and packages are in development.
They may not be fully stable and should be used with caution. We make no claims about them.