The hardware and bandwidth for this mirror is donated by METANET, the Webhosting and Full Service-Cloud Provider.
If you wish to report a bug, or if you are interested in having us mirror your free-software or open-source project, please feel free to contact us at mirror[@]metanet.ch.
The vennLasso package provides methods for hierarchical
variable selection for models with covariate effects stratified by
multiple binary factors.
The vennLasso package can be installed from CRAN
using:
install.packages("vennLasso")The development version can be installed using the devtools package:
devtools::install_github("jaredhuling/vennLasso")or by cloning and building.
Load the vennLasso package:
library(vennLasso)Access help file for the main fitting function
vennLasso() by running:
?vennLassoHelp file for cross validation function cv.vennLasso()
can be accessed by running:
?cv.vennLassoSimulate heterogeneous data:
set.seed(100)
dat.sim <- genHierSparseData(ncats = 3,  # number of stratifying factors
                             nvars = 25, # number of variables
                             nobs = 150, # number of observations per strata
                             nobs.test = 10000,
                             hier.sparsity.param = 0.5,
                             prop.zero.vars = 0.75, # proportion of variables
                                                   # zero for all strata
                             snr = 0.5,  # signal-to-noise ratio
                             family = "gaussian")

# design matrices
x        <- dat.sim$x
x.test   <- dat.sim$x.test

# response vectors
y        <- dat.sim$y
y.test   <- dat.sim$y.test

# binary stratifying factors
grp      <- dat.sim$group.ind
grp.test <- dat.sim$group.ind.test
Inspect the populations for each strata:
plotVenn(grp)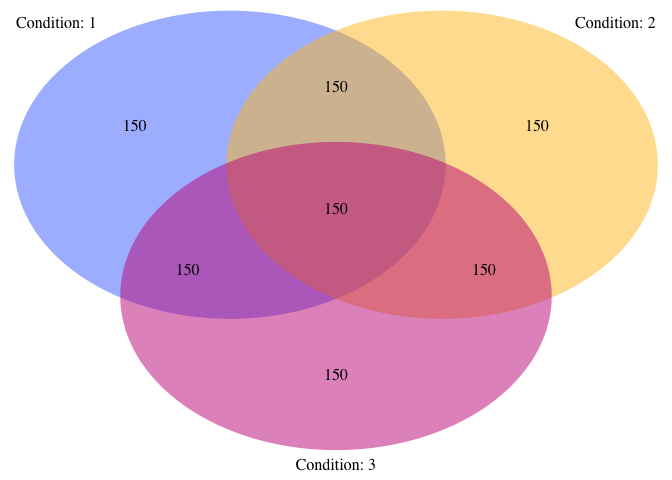
Fit vennLasso model with tuning parameter selected with 5-fold cross validation:
fit.adapt <- cv.vennLasso(x, y,
                          grp,
                          adaptive.lasso = TRUE,
                          nlambda        = 50,
                          family         = "gaussian",
                          standardize    = FALSE,
                          intercept      = TRUE,
                          nfolds         = 5)
Plot selected variables for each strata (not run):
library(igraph)##
## Attaching package: 'igraph'## The following objects are masked from 'package:stats':
##
## decompose, spectrum## The following object is masked from 'package:base':
##
## unionplotSelections(fit.adapt)Predict response for test data:
preds.vl <- predict(fit.adapt, x.test, grp.test, s = "lambda.min",
                    type = 'response')
Evaluate mean squared error:
mean((y.test - preds.vl) ^ 2)## [1] 0.6837243mean((y.test - mean(y.test)) ^ 2)## [1] 1.011026Compare with naive model with all interactions between covariates and stratifying binary factors:
df.x <- data.frame(y = y, x = x, grp = grp)
df.x.test <- data.frame(x = x.test, grp = grp.test)

# create formula for interactions between factors and covariates
form <- paste("y ~ (", paste(paste0("x.", 1:ncol(x)), collapse = "+"), ")*(grp.1*grp.2*grp.3)" )
Fit linear model and generate predictions for test set:
lmf <- lm(as.formula(form), data = df.x)

preds.lm <- predict(lmf, df.x.test)
Evaluate mean squared error:
mean((y.test - preds.lm) ^ 2)## [1] 0.8056107mean((y.test - preds.vl) ^ 2)## [1] 0.6837243These binaries (installable software) and packages are in development.
They may not be fully stable and should be used with caution. We make no claims about them.