The hardware and bandwidth for this mirror is donated by METANET, the Webhosting and Full Service-Cloud Provider.
If you wish to report a bug, or if you are interested in having us mirror your free-software or open-source project, please feel free to contact us at mirror[@]metanet.ch.
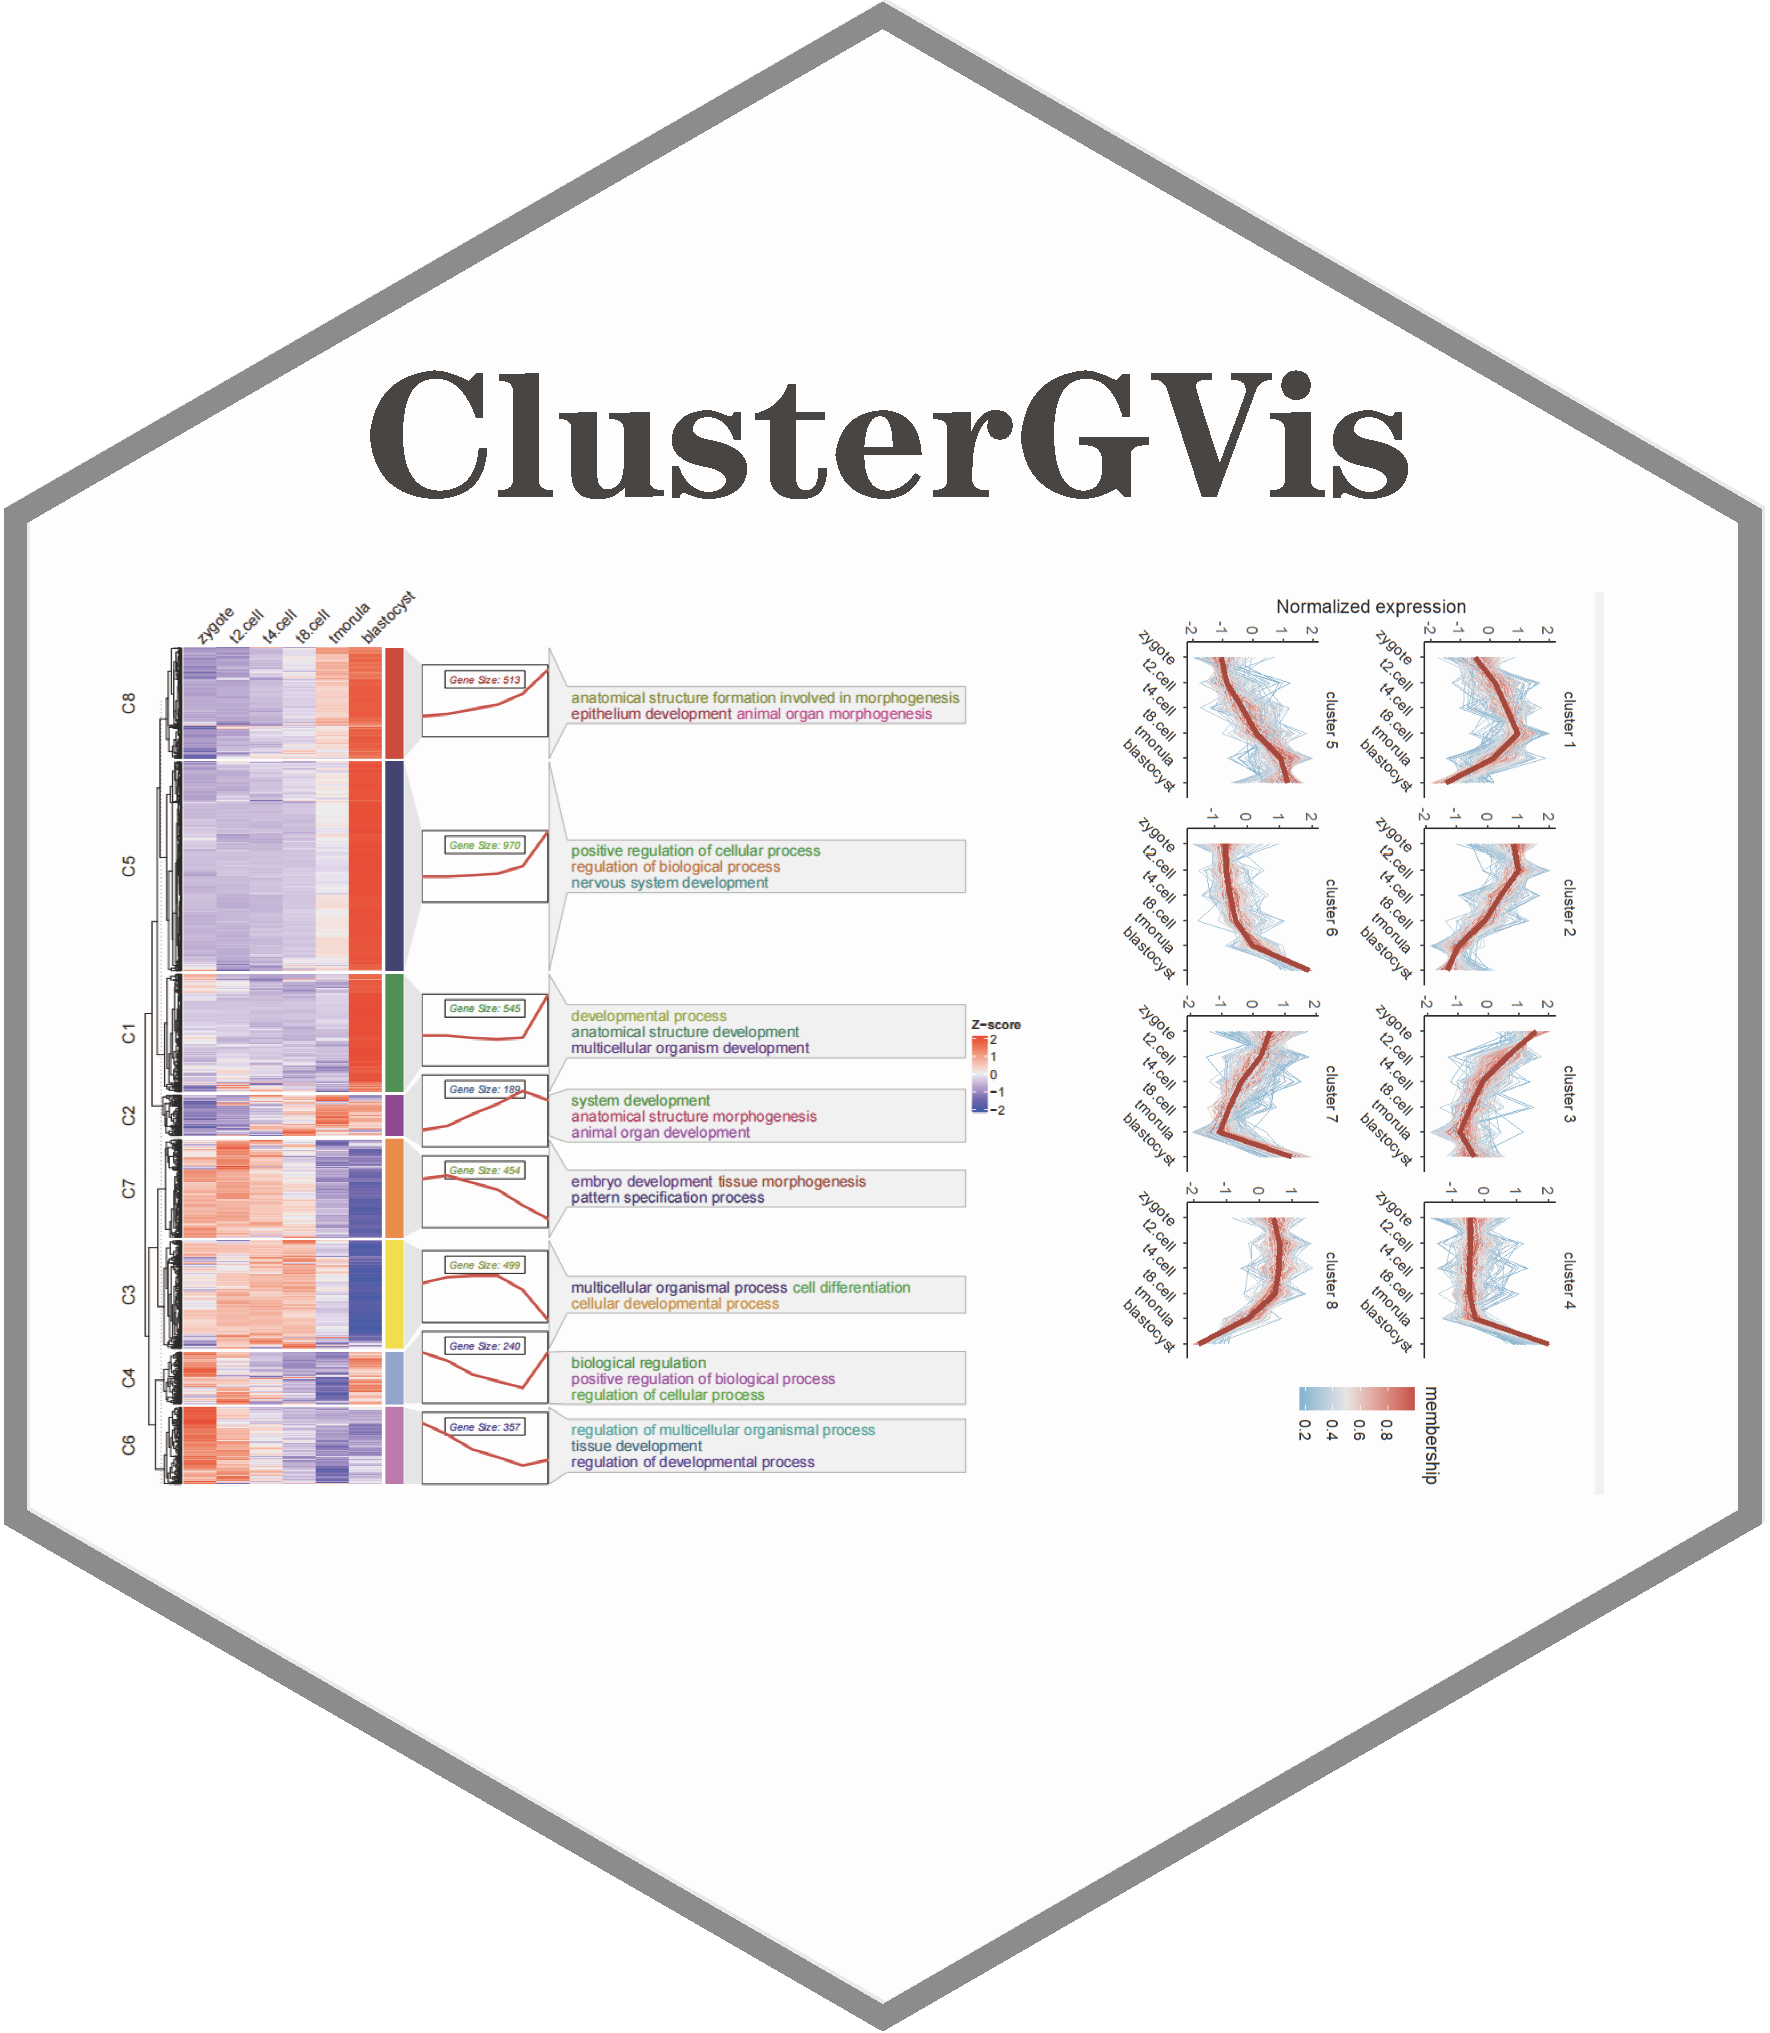
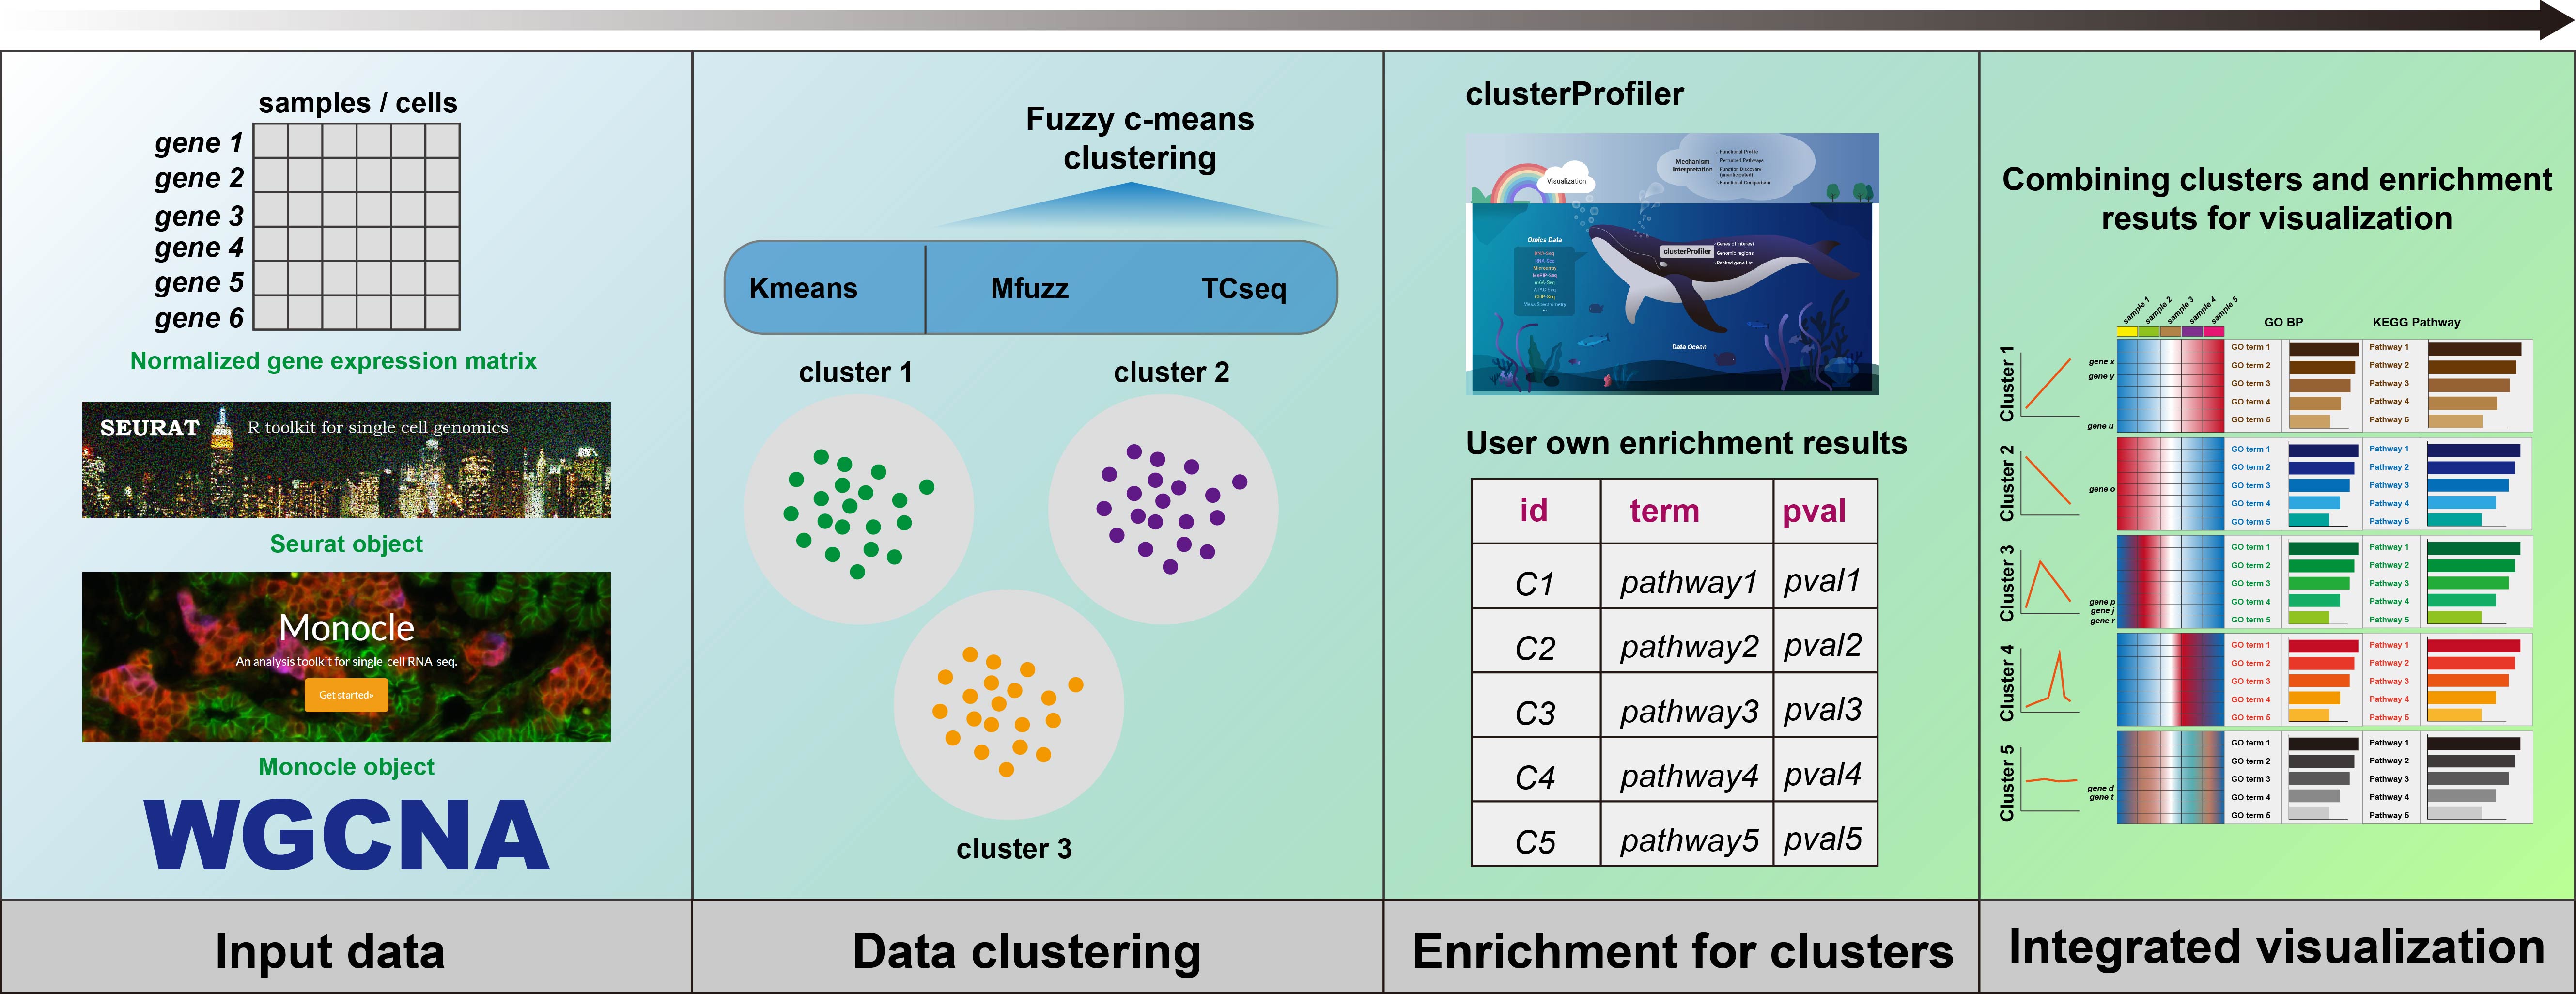
To enhance clustering and visualization of time-series gene expression data from RNA-Seq experiments, we present the ClusterGVis package. This tool enables concise and elegant analysis of time-series gene expression data in a simple, one-step operation. Additionally, you can perform enrichment analysis for each cluster using the enrichCluster function, which integrates seamlessly with clusterProfiler. ClusterGVis empowers you to create publication-quality visualizations with ease.
Thanks for the contributions for clusterProfiler and ComplexHeatmap!
There are some R package to make sure have been installed for better installing ClusterGVis:
BiocManager::install("ComplexHeatmap")
BiocManager::install("clusterProfiler")
BiocManager::install("TCseq")
BiocManager::install("Mfuzz")
BiocManager::install("monocle")
devtools::install_github('cole-trapnell-lab/monocle3')
install.packages("circlize")
install.packages("Seurat")You can install the development version of ClusterGVis like so:
# install from cran
install.packages("ClusterGVis")

# Note: please update your ComplexHeatmap to the latest version!
# install.packages("devtools")
devtools::install_github("junjunlab/ClusterGVis")Jun Zhang (2022). ClusterGVis: One-step to Cluster and Visualize Gene Expression Matrix. https://github.com/junjunlab/ClusterGVis
The comprehensive documentation: https://junjunlab.github.io/ClusterGvis-manual/
https://github.com/junjunlab/ClusterGvis-app
- ClusterGVis 对基因表达时间序列聚类和可视化
- ClusterGVis 的问题解答及优化
- ClusterGVis 对指定 cluster 添加注释
- ClusterGVis 继续查缺补漏
- ClusterGVis 添加多个样本注释
- bugs 报告和修复
- ClusterGVis 对接单细胞啦
- 听说你还想添加 KEGG 注释?
- ClusterGVis 对接 monocle2 拟时序热图
- 听说你想画个 monocle3 的拟时序热图?
- ClusterGVis 添加自定义图形注释
- 听说你想插入 GO 和 KEGG 图形注释?
- enrichCluster 关于非模式物种富集分析的使用
- 听说你想给 visCluster 添加行注释?
- ClusterGVis shiny 交互式 web 来了?
These binaries (installable software) and packages are in development.
They may not be fully stable and should be used with caution. We make no claims about them.