The hardware and bandwidth for this mirror is donated by METANET, the Webhosting and Full Service-Cloud Provider.
If you wish to report a bug, or if you are interested in having us mirror your free-software or open-source project, please feel free to contact us at mirror[@]metanet.ch.

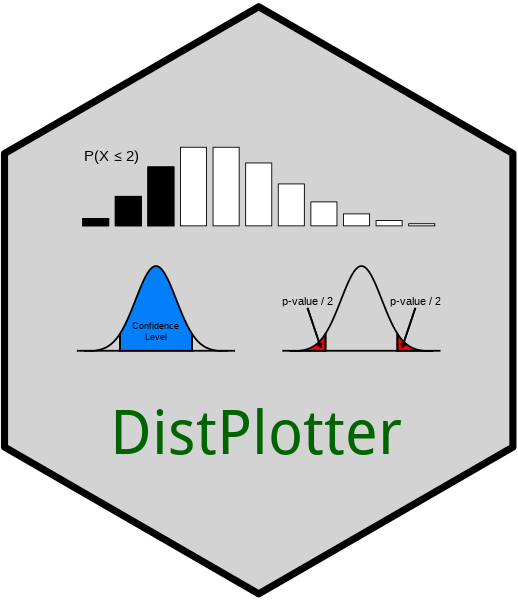
A graphical user interface for plotting common univariate distributions
The DistPlotter R package includes an
interactive Shiny application, which is run locally on the user’s
machine. It enables users to plot common univariate distributions and
was designed with a particular focus on education. Users can plot
distributions based on general shape (e.g., symmetric vs. skewed right)
and distributions from common discrete and continuous families. They can
also shade areas underneath the curve (e.g., areas corresponding to
general probabilities, p-values, or confidence levels). Users can
additionally plot their own quantitative data, as well as overlay a
normal density curve and shade area(s) underneath.
The DistPlotter package can be installed from either
CRAN or
GitHub.
To install from CRAN, run the following code in R:
install.packages("DistPlotter")To install the package from GitHub, run the following code in
R:
install.packages("remotes")  # installs the remotes package for accessing the install_github() function
remotes::install_github("shinyeducationapps/DistPlotter") # installs the DistPlotter packageThe DistPlotter application can be run using a single
line of code in R:
DistPlotter::runDistPlotterApp()If you happen to find any bugs, we kindly ask that you email us at casementc@gmail.com.
DistPlotter is distributed under the MIT license. For
details, see the LICENSE.md file.
These binaries (installable software) and packages are in development.
They may not be fully stable and should be used with caution. We make no claims about them.