The hardware and bandwidth for this mirror is donated by METANET, the Webhosting and Full Service-Cloud Provider.
If you wish to report a bug, or if you are interested in having us mirror your free-software or open-source project, please feel free to contact us at mirror[@]metanet.ch.

GCalignR provides simple functions to align peak lists
obtained from Gas Chromatography Flame Ionization Detectors (GC-FID)
based on retention times and plots to evaluate the quality of the
alignment. The package supports any other one-dimensional chromatography
technique that enables the user to create a peak list with at least one
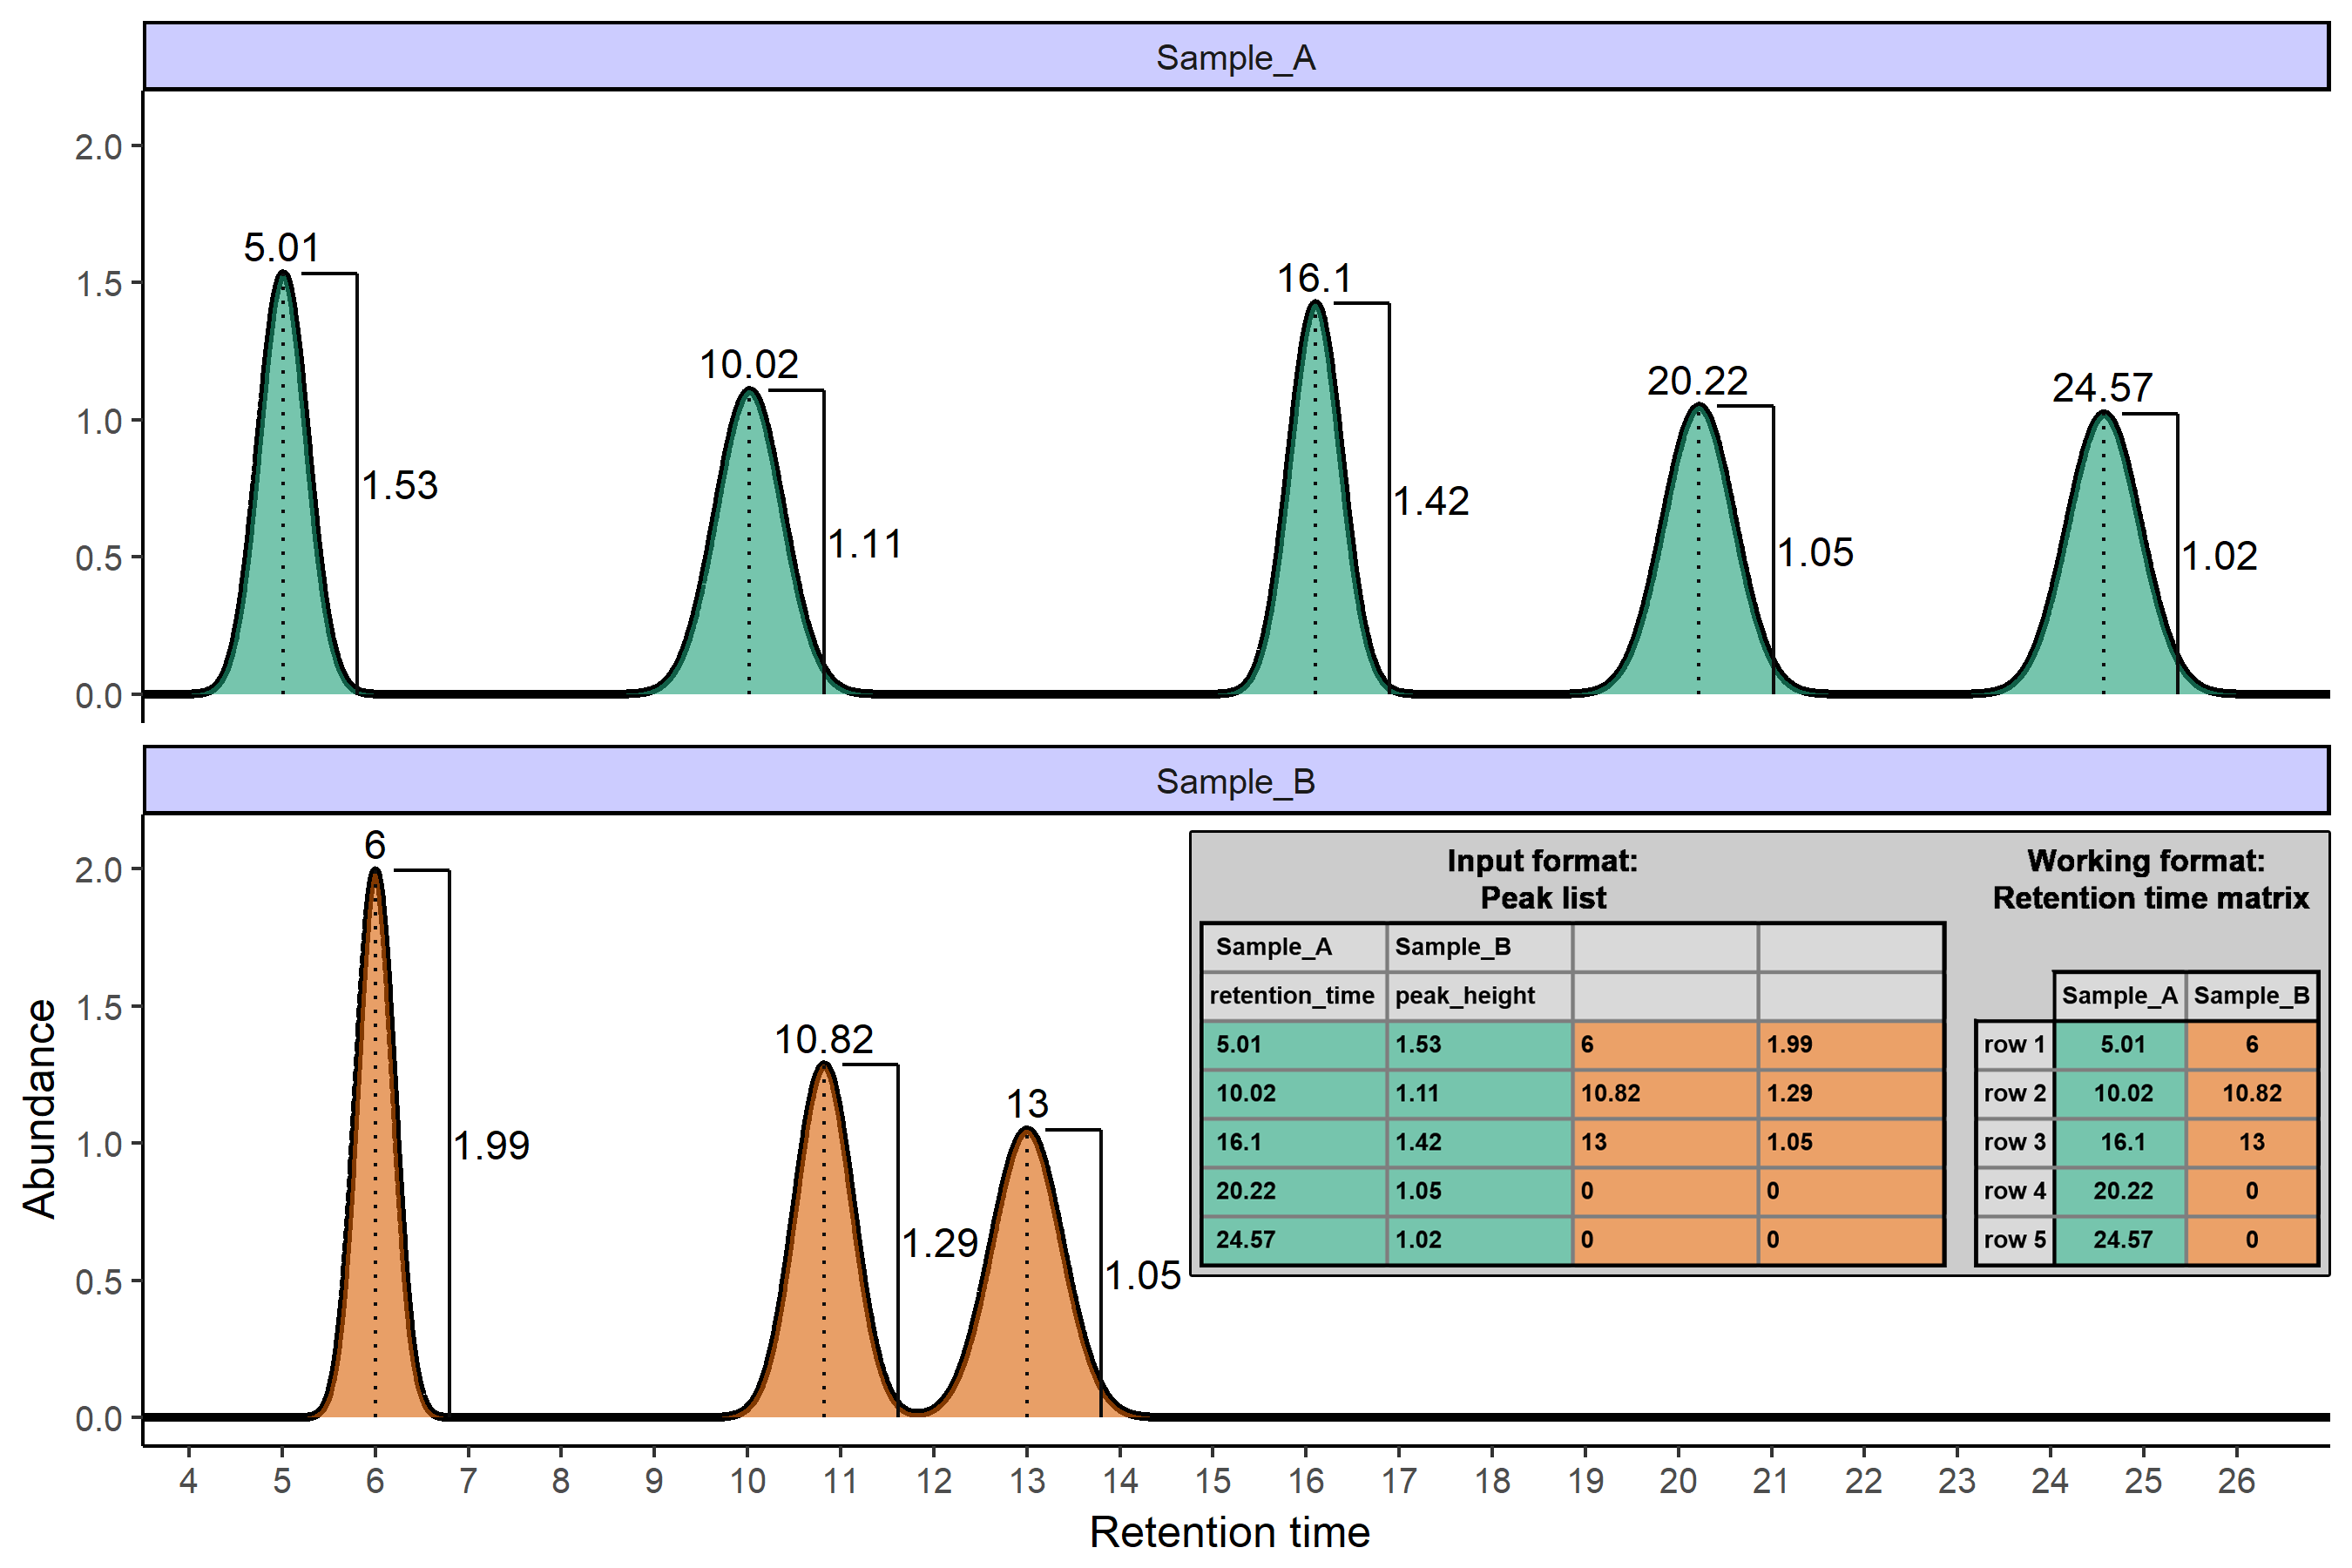
column specifying retention times as illustrated below.

As with other software you need to get used to the input format which is shown in the illustration:
The latest release v1.0.6 is on CRAN. Click here for an overview of past releases and a brief description of applied changes.
install.packages("GCalignR", dependencies = T)The current developmental version is identical to the CRAN release
if (!("devtools" %in% rownames(installed.packages()))) {
    install.packages("devtools")
} else if (packageVersion("devtools") < 1.6) {
    install.packages("devtools")
}
devtools::install_github("mottensmann/GCalignR", build_vignettes = TRUE)To get started read the vignettes:
browseVignettes("GCalignR")Basic usage of the main function to align peaks:
data: Path to a text file (see input format above), or
list of data frames, each corresponding to a samplert_col_name: column name of retention time valuesmax_linear_shift: Here, no adjustment of systematic
linear driftmax_diff_peak2mean: Here, sort all peaks strictly by
retention timemin_diff_peak2peak: Here, try to merge peaks when rt
differs by less than 0.1library(GCalignR)
#> Warning: package 'GCalignR' was built under R version 4.4.1aligned <- align_chromatograms(data = peak_data[1:4], # list of data frame
rt_col_name = "time", # retention time
max_linear_shift = 0, #
max_diff_peak2mean = 0,
min_diff_peak2peak = 0.08)
#> Run GCalignR
#> Start: 2024-07-03 14:53:38
#>
#> Data for 4 samples loaded.
#> No reference was specified. Hence, a reference will be selected automatically ...
#>
#> 'C2' was selected on the basis of highest average similarity to all samples (score = 0.06).
#> Start correcting linear shifts with "C2" as a reference ...
#>
#> Start aligning peaks ... this might take a while!
#>
#> Merge redundant rows ...
#>
#> Alignment completed!
#> Time: 2024-07-03 14:53:41The parameter values above differ from the defaults shown in
the paper and the package vignette. In a nutshell, we now suggest in
most cases to set max_diff_peak2mean = 0. This way peaks
are first simply sorted based on the given retention time value and then
purely min_diff_peak2peak specifies which peaks will be
evaluated for a merge. Additionally, this enables the possibility for a
considerable boost in computation speed of the first alignment steps
(available since version 1.0.5, currently only on GitHub!)
If you encounter bugs or if you have any suggestions for improvement (for instance on how to speed up the algorithm!), just contact meinolf.ottensmann[at]web.de
Also I´m happy to provide help if you can´t get it to work. Usually it is easy to solve small problems. However, in order to simplify this process please send a short description of the problem along with the code you have been using as a script file (.R) together with a minimal example input file (.txt).
#> Warning: package 'ggplot2' was built under R version 4.4.1
These binaries (installable software) and packages are in development.
They may not be fully stable and should be used with caution. We make no claims about them.