The hardware and bandwidth for this mirror is donated by METANET, the Webhosting and Full Service-Cloud Provider.
If you wish to report a bug, or if you are interested in having us mirror your free-software or open-source project, please feel free to contact us at mirror[@]metanet.ch.
Note: Please check here for earlier versions of MVPapp (<= v0.3.3).

MVPapp is an R package that bundles the
Model
Visualization Platform (MVP) Shiny application for local use and/or
deployment. MVP is an interactive pharmacometrics environment requiring
minimal setup from the users, and is developed with user-friendliness as
a top priority so even non-modelers may be able to explore different
aspects of the models without too much hassle, whilst balancing
complexity for advanced users. Some features include:
- Live code editing using
mrgsolve
- Automatic model translation into mrgsolve,
rxode2,
or NONMEM code using generative AI
- Flexible dosing regimens, supporting up to 5 independent dosing
schedules per model
- Basic data exploration and data cleaning, and overlaying of data
- Quick NCA output and reporting
- Model comparison to visualize differences
- Parameter sensitivity analysis to easily evaluate impact of changing
parameters
- Automatic PK/PD metrics using a user-defined time range
- Variability assessment using external databases such as the
NHANES,
WHO, and
CDC virtual patients
- Custom covariate distributions to further assess variability
- Saving and restoring sessions, and off-the-shelf 100%
reproducible code for all simulations readily available
The goal of MVP is to support initial model development and facilitate internal discussions more efficiently.
MVPapp is not currently on CRAN. Install it via the
pak R package:
## Install pak first if required
# install.packages("pak")

options(pkg.build_vignettes = TRUE)
pak::pak("stevechoy/MVPapp")
# options(pkg.build_vignettes = FALSE)  # reset option if required
Once installed, launch MVP using the following commands:
library(MVPapp)
run_mvp()

## Alternatively, launch the app without watermarks
## see ?run_mvp for more options
# run_mvp(insert_watermark = FALSE)
Alternatively, if installing packages is restricted, you may run the
development version of MVPapp directly from GitHub
without installing it. Its dependencies (see the
Imports field of the DESCRIPTION
file) must already be installed; the app checks this on launch and lists
anything missing:
shiny::runGitHub("MVPapp", username = "stevechoy", subdir = "inst/shiny", launch.browser = TRUE)Note that this runs the latest code on GitHub, which may include changes that are not yet in the CRAN release.
This is the default landing page when the App is launched. It looks a bit empty at the moment, however it is very simple to start generating a model and show a plot. All important settings are neatly situated together on the same page so the user can appreciate in real-time whenever they change certain aspects of the model. This page should be the homepage as other pages of the app inherit settings from this page (e.g. dosing and axis choices).
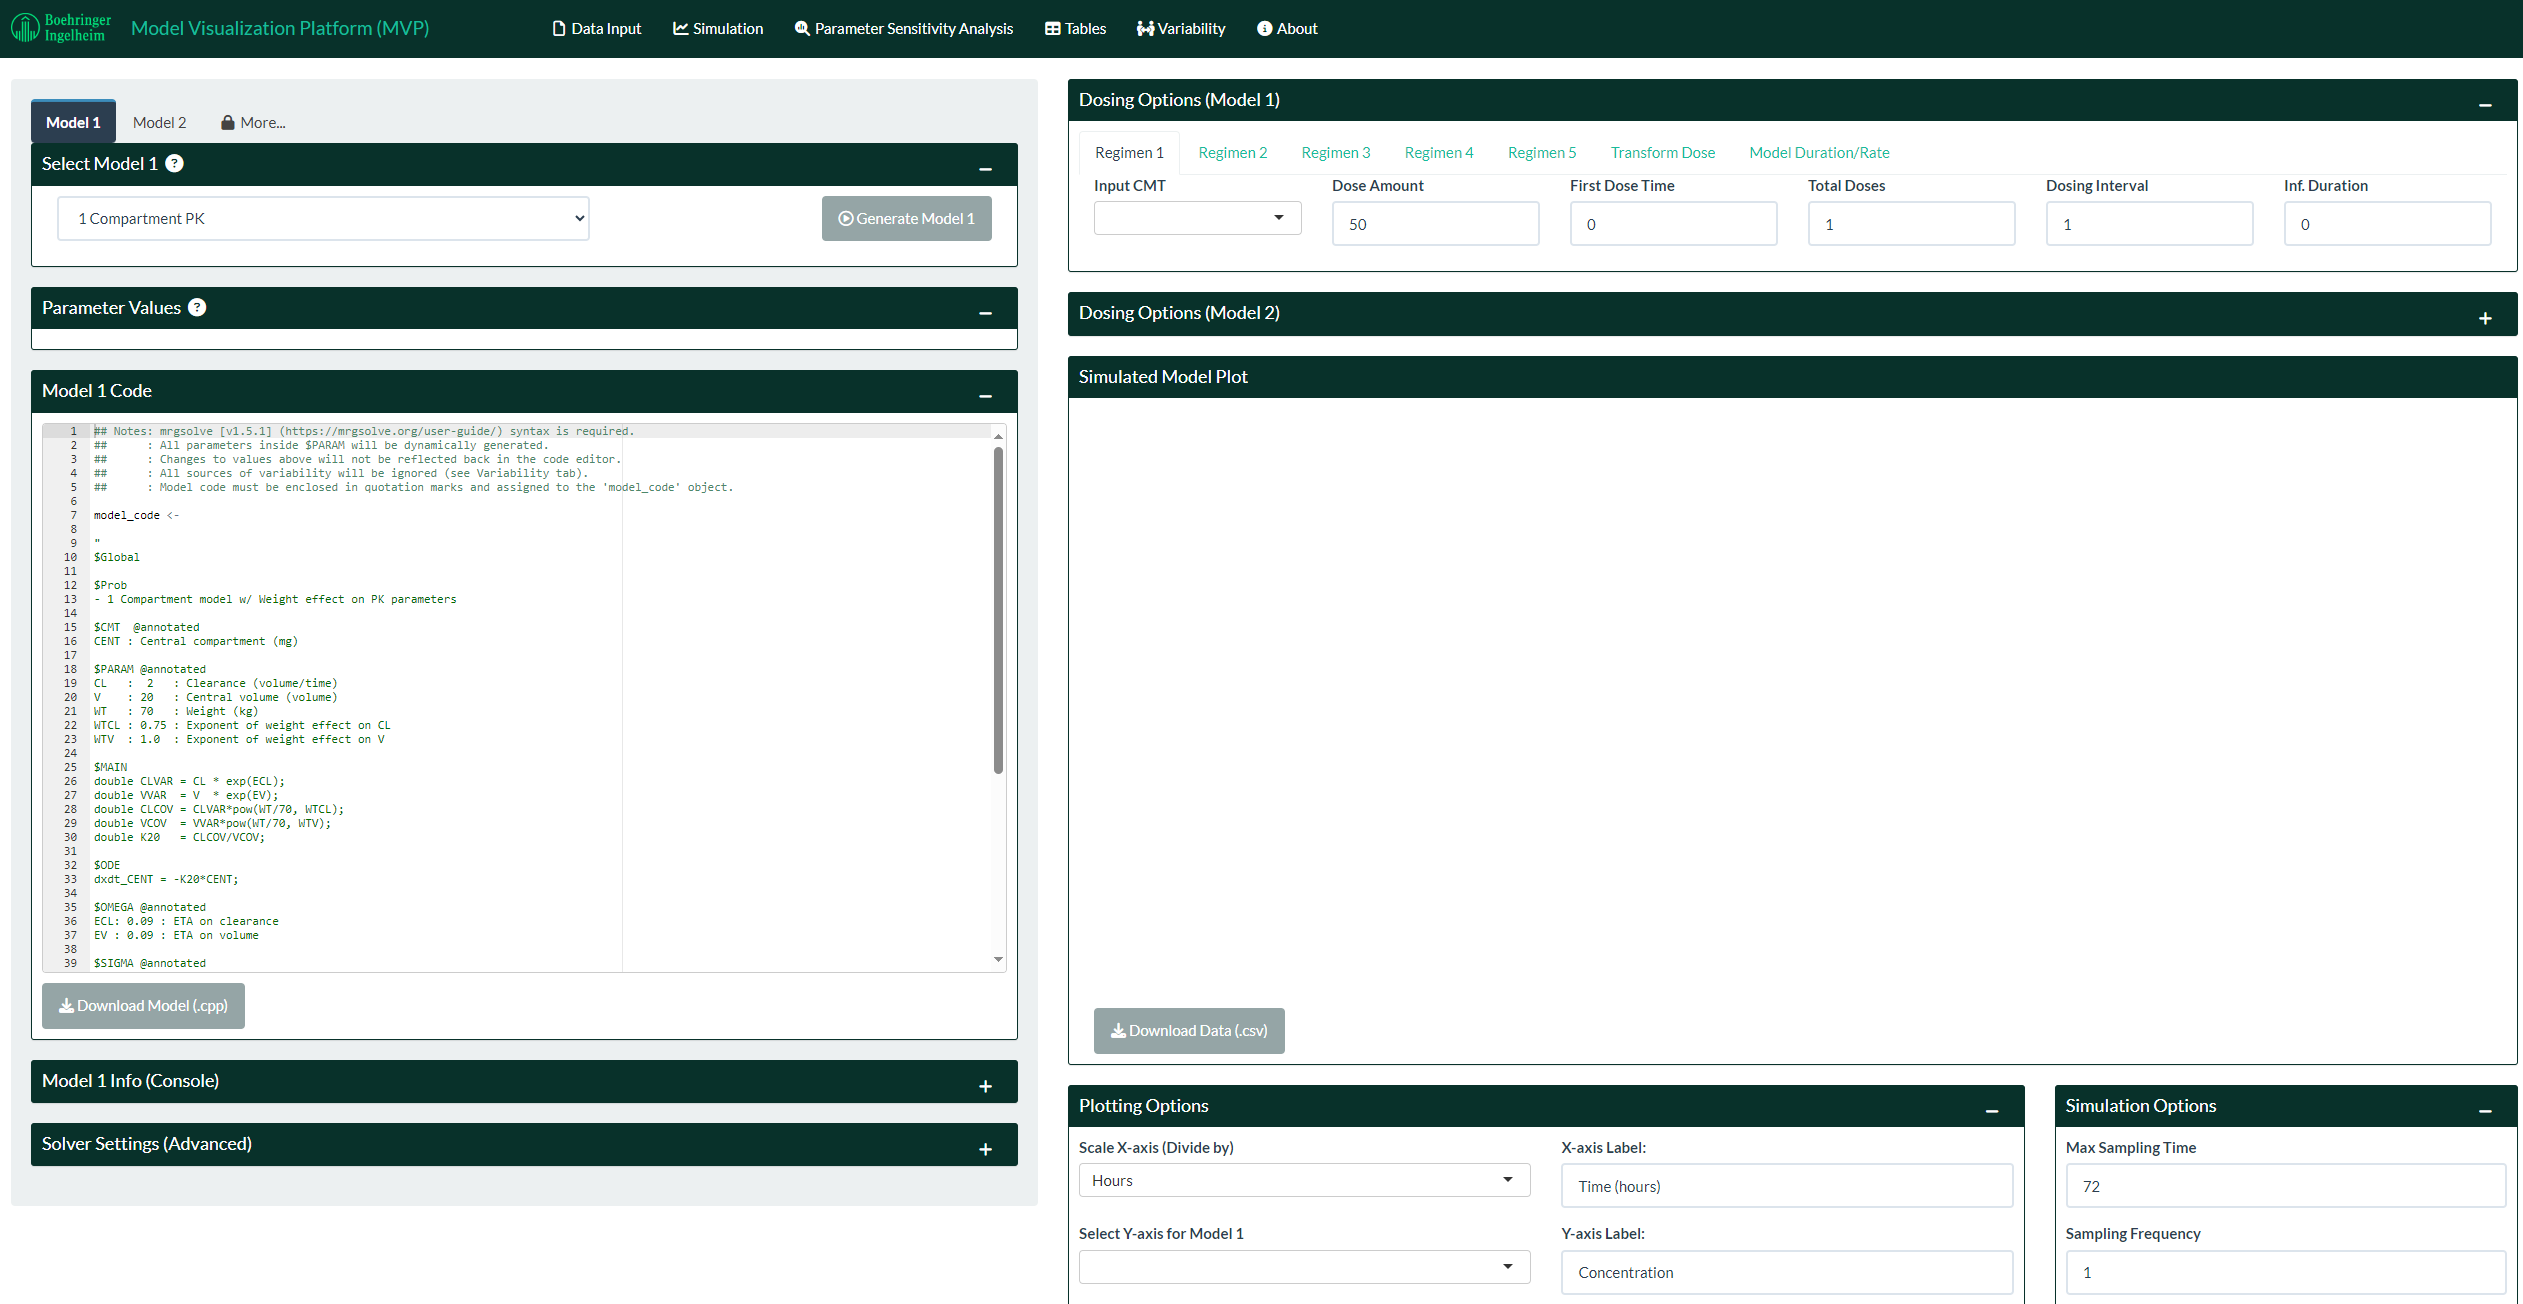
model_code object, and initialized as
model_object. Therefore, if the model code contains
quotation marks, the user will have to remove those manually (or escape
them using the back slash, \) to avoid compilation
errors.Generate Model 1 button. If the model
compiles, the “Parameter Values” box will be populated, and a plot will
show up on the right hand side.
zero_re() from mrgsolve is
applied). Navigate to the Variability Page if you want to assess
variability in populations (see section below).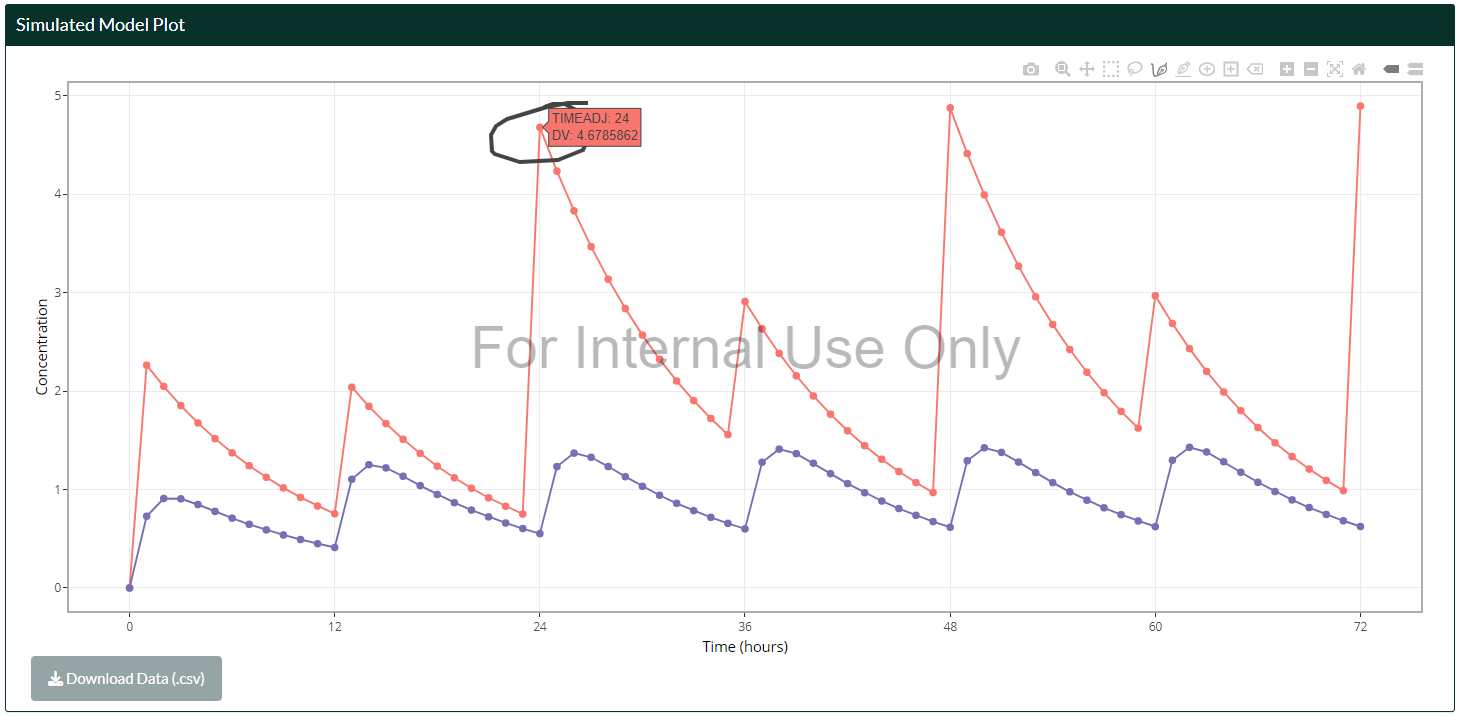
plotly package), which allows zooming, panning, drawing
etc, controlled from the top right of the plot. The camera icon
downloads the current plot, based on the options set by the “Download
Options” box on the bottom right of the page. Tip: if plots take a long
time to load, turning off interactive plots may help
with speeding things up.
Uploading NONMEM-formatted datasets (.csv) and tab-delimited text files (.txt) is supported in the “Data Input” page. Some default cleaning options are applied automatically from the “Built-in Dataset Cleaning Options” box. Further filtering and cleaning may be applied in the code editor on the left hand side. The dataset should have the “ID”, “TIME”, and “DV” columns to be fully supported by the rest of the app (e.g. data overlay). At minimum, only the “ID” column is required to support Data Exploration in the Data Input page. If missing, the user may create / rename these columns using the code editor.
General plots are flexible plots that can handle continuous/continuous, continuous/discrete (Box plot option), and discrete/discrete (Box plot option) types of data.
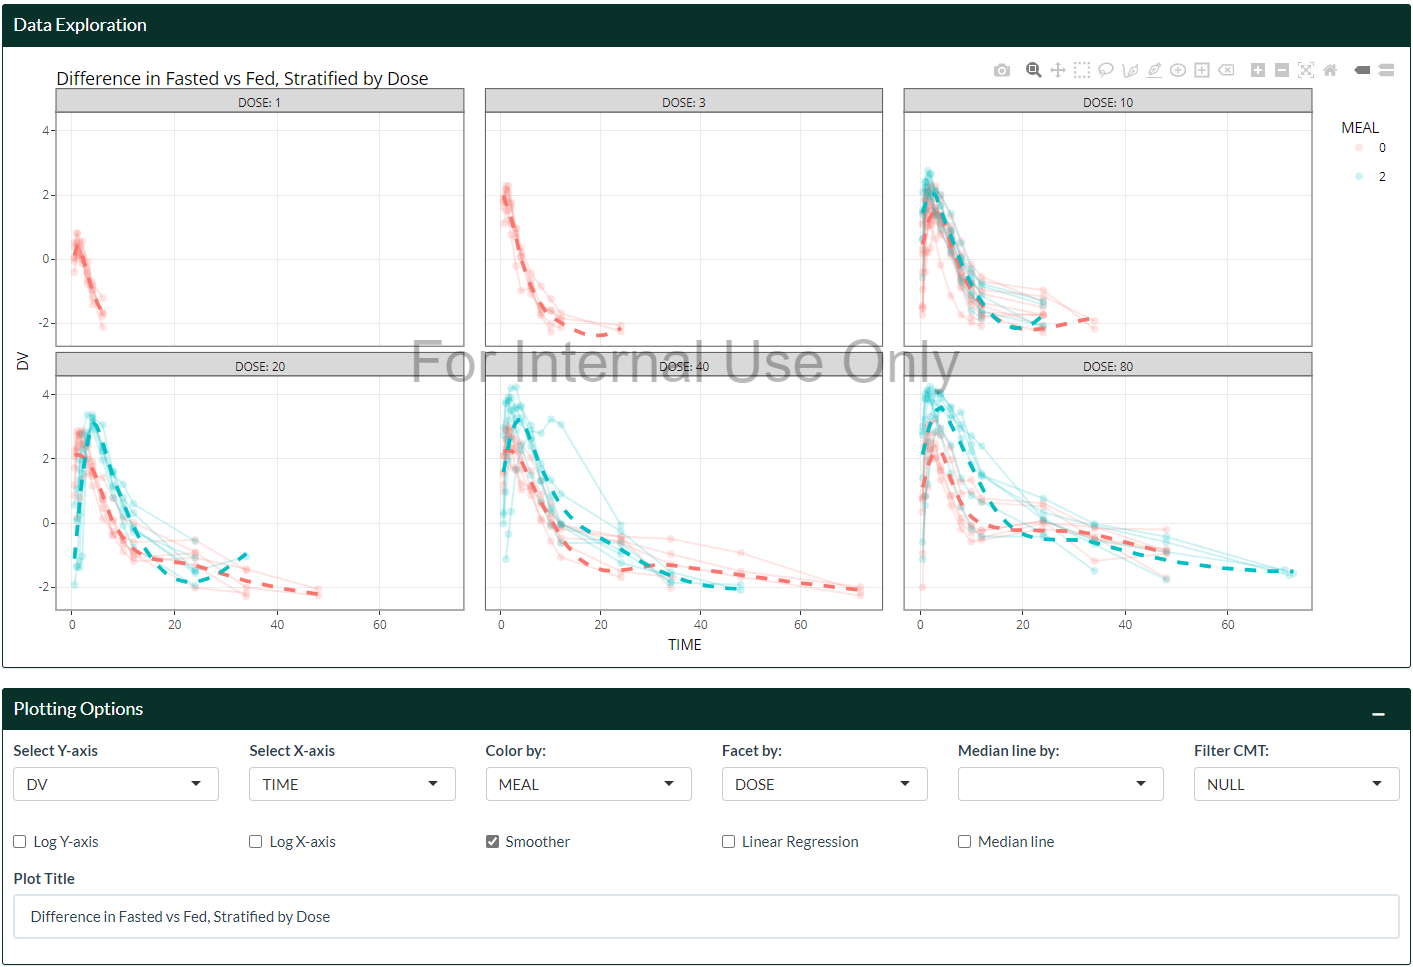
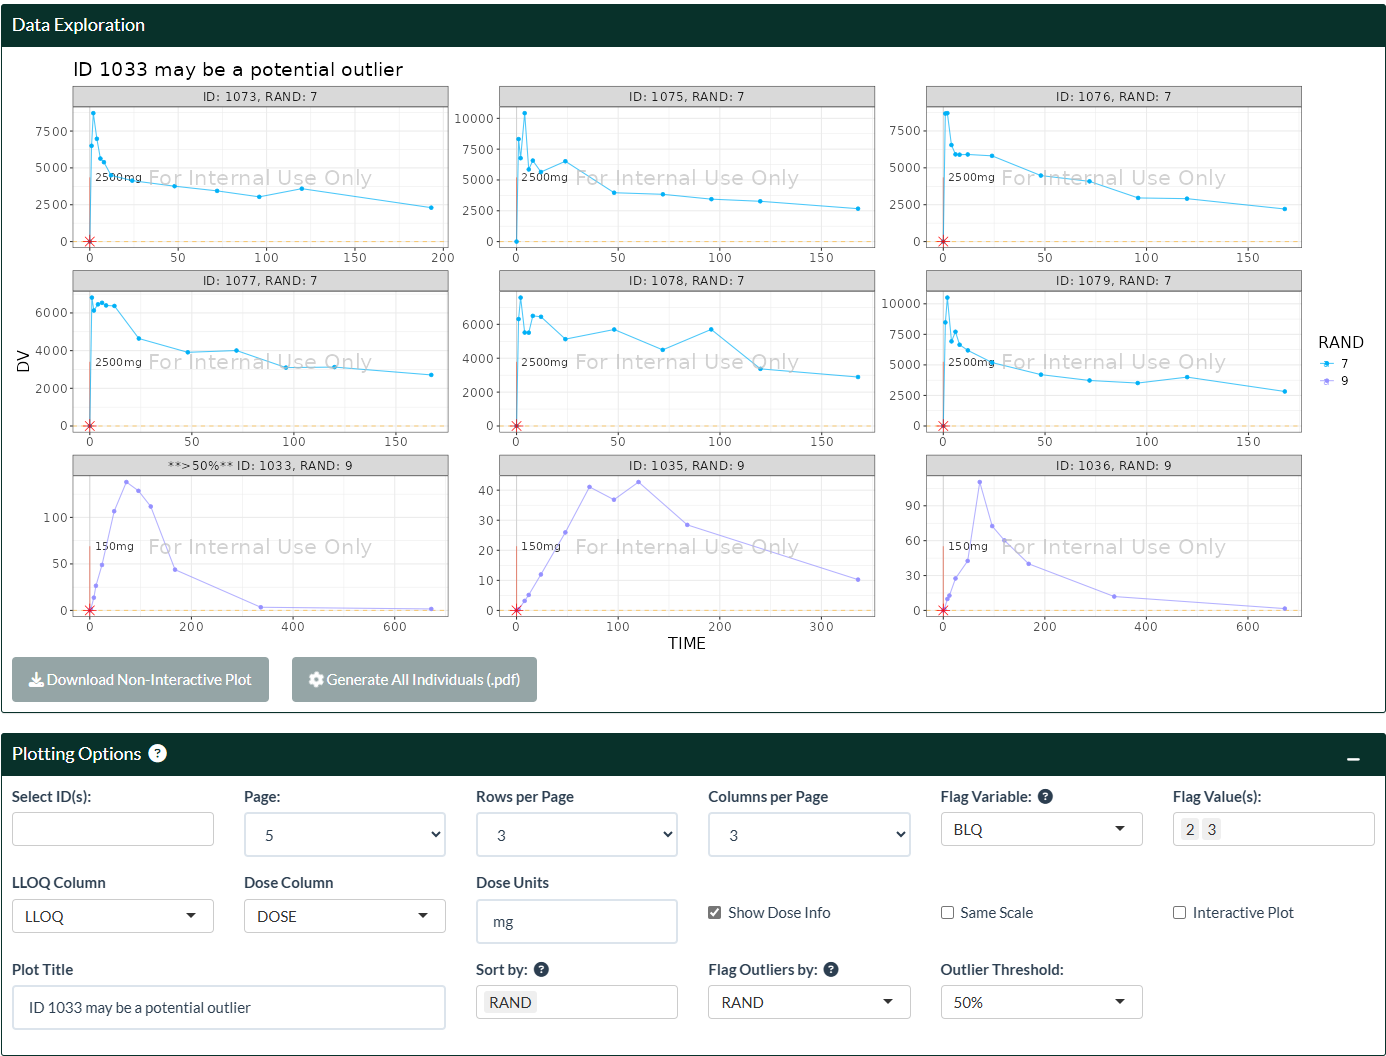
Settings from General Plots will be carried over to the “Ind. Plot”, where users can explore individual profiles in more detail. Dosing information (“EVID”, “ADDL”, “II”, “RATE” columns) can be inserted on each plot when the Dose Column is provided. There are also options to highlight values and automatically identify potential outliers according to a stratification group. LLOQ information can also be inserted.
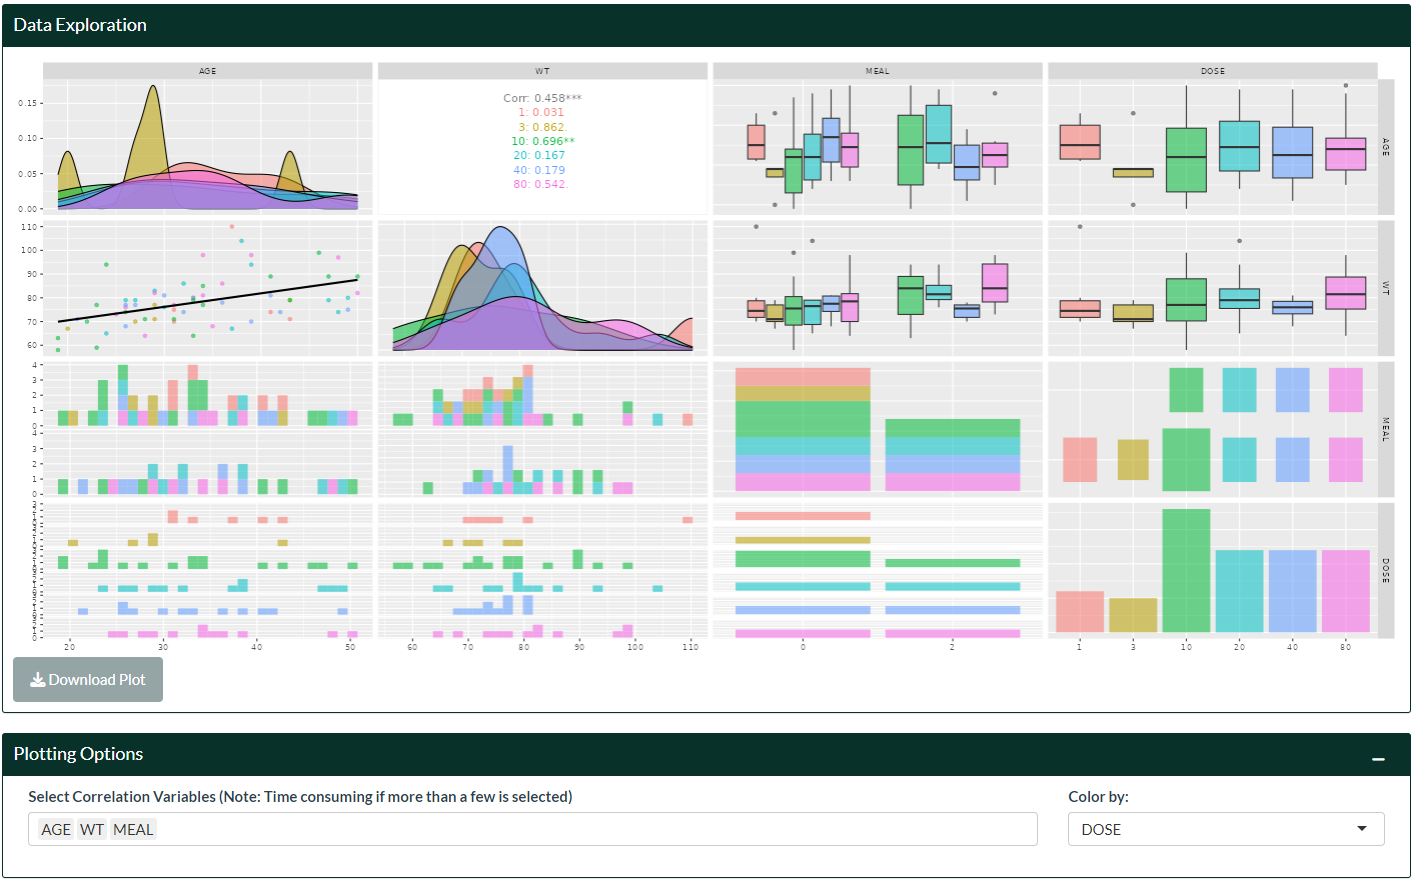
Correlation plots are grouped by ID and are useful to explore potential correlations between covariates.
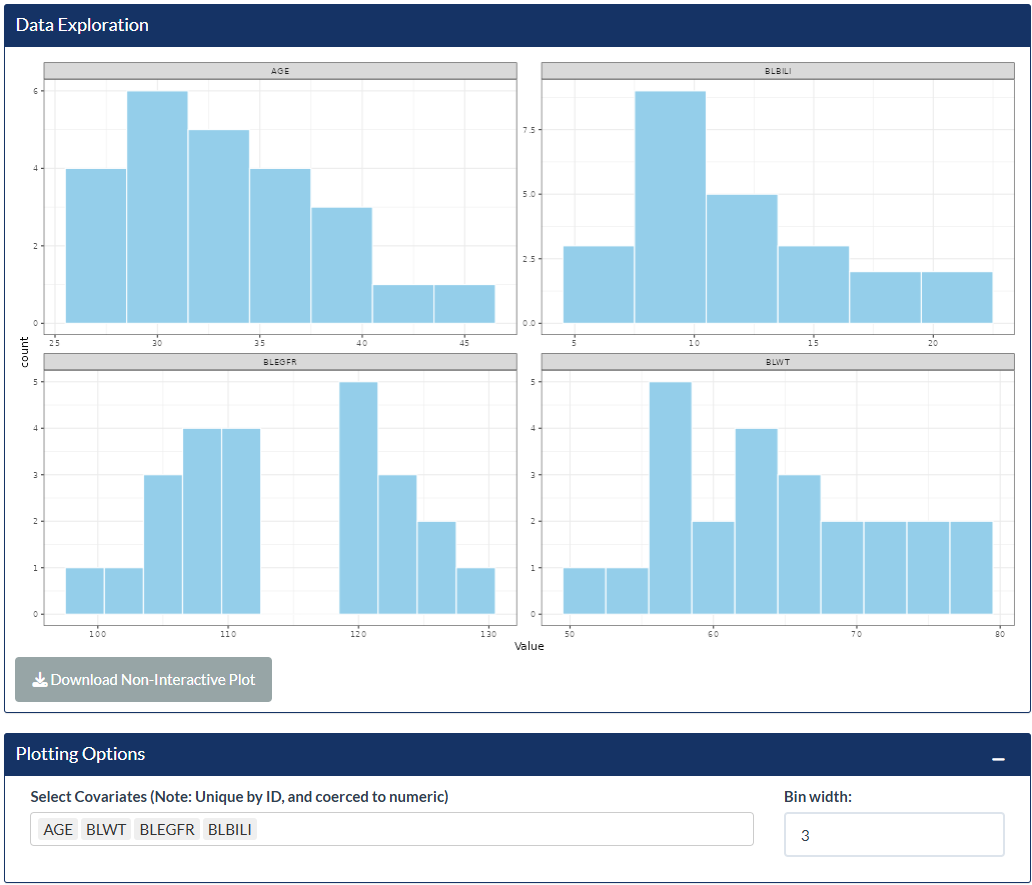
Covariate histogram plots are a quick way to check for outliers in the datasets (plots are distinct by ID, which usually displays the baseline).
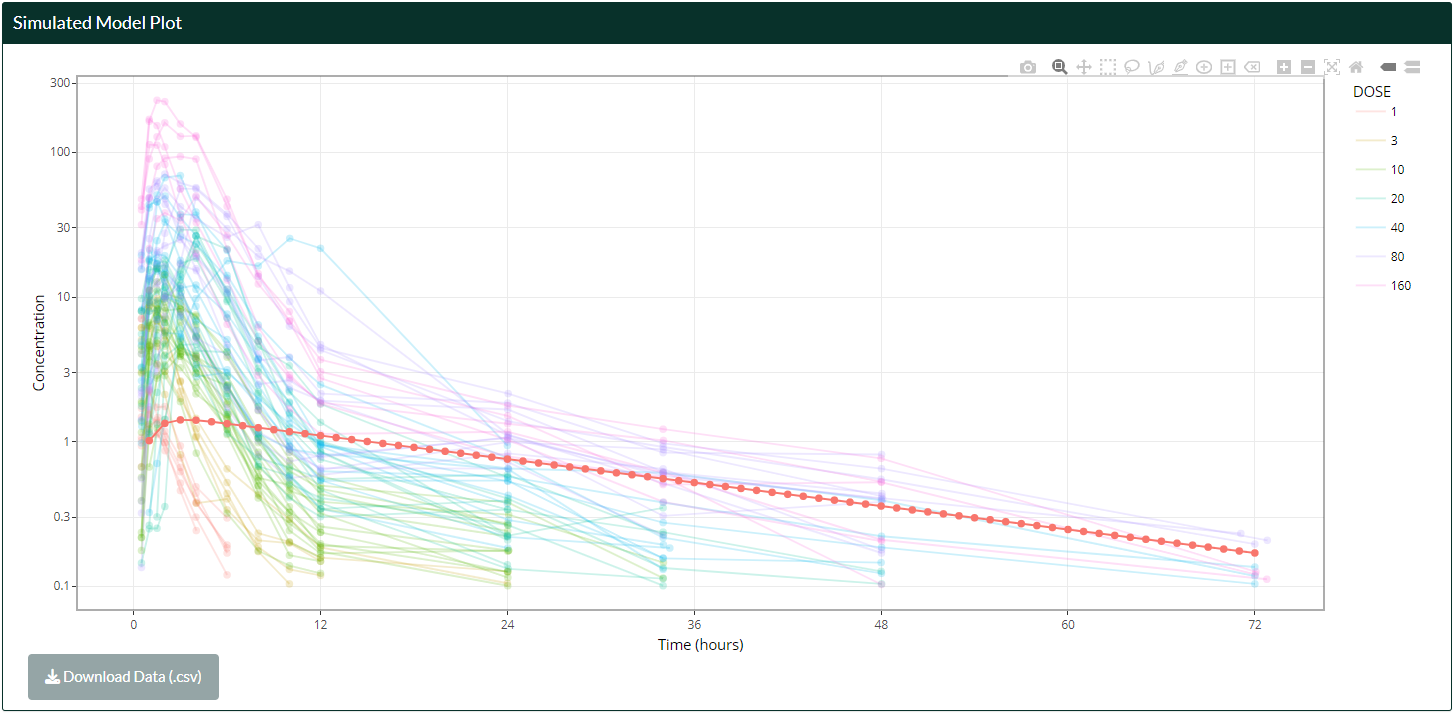
Note: once a dataset is uploaded, its display can be toggled on other pages by checking the “Overlay Dataset” checkbox in the “Plotting Options” in each respective page!
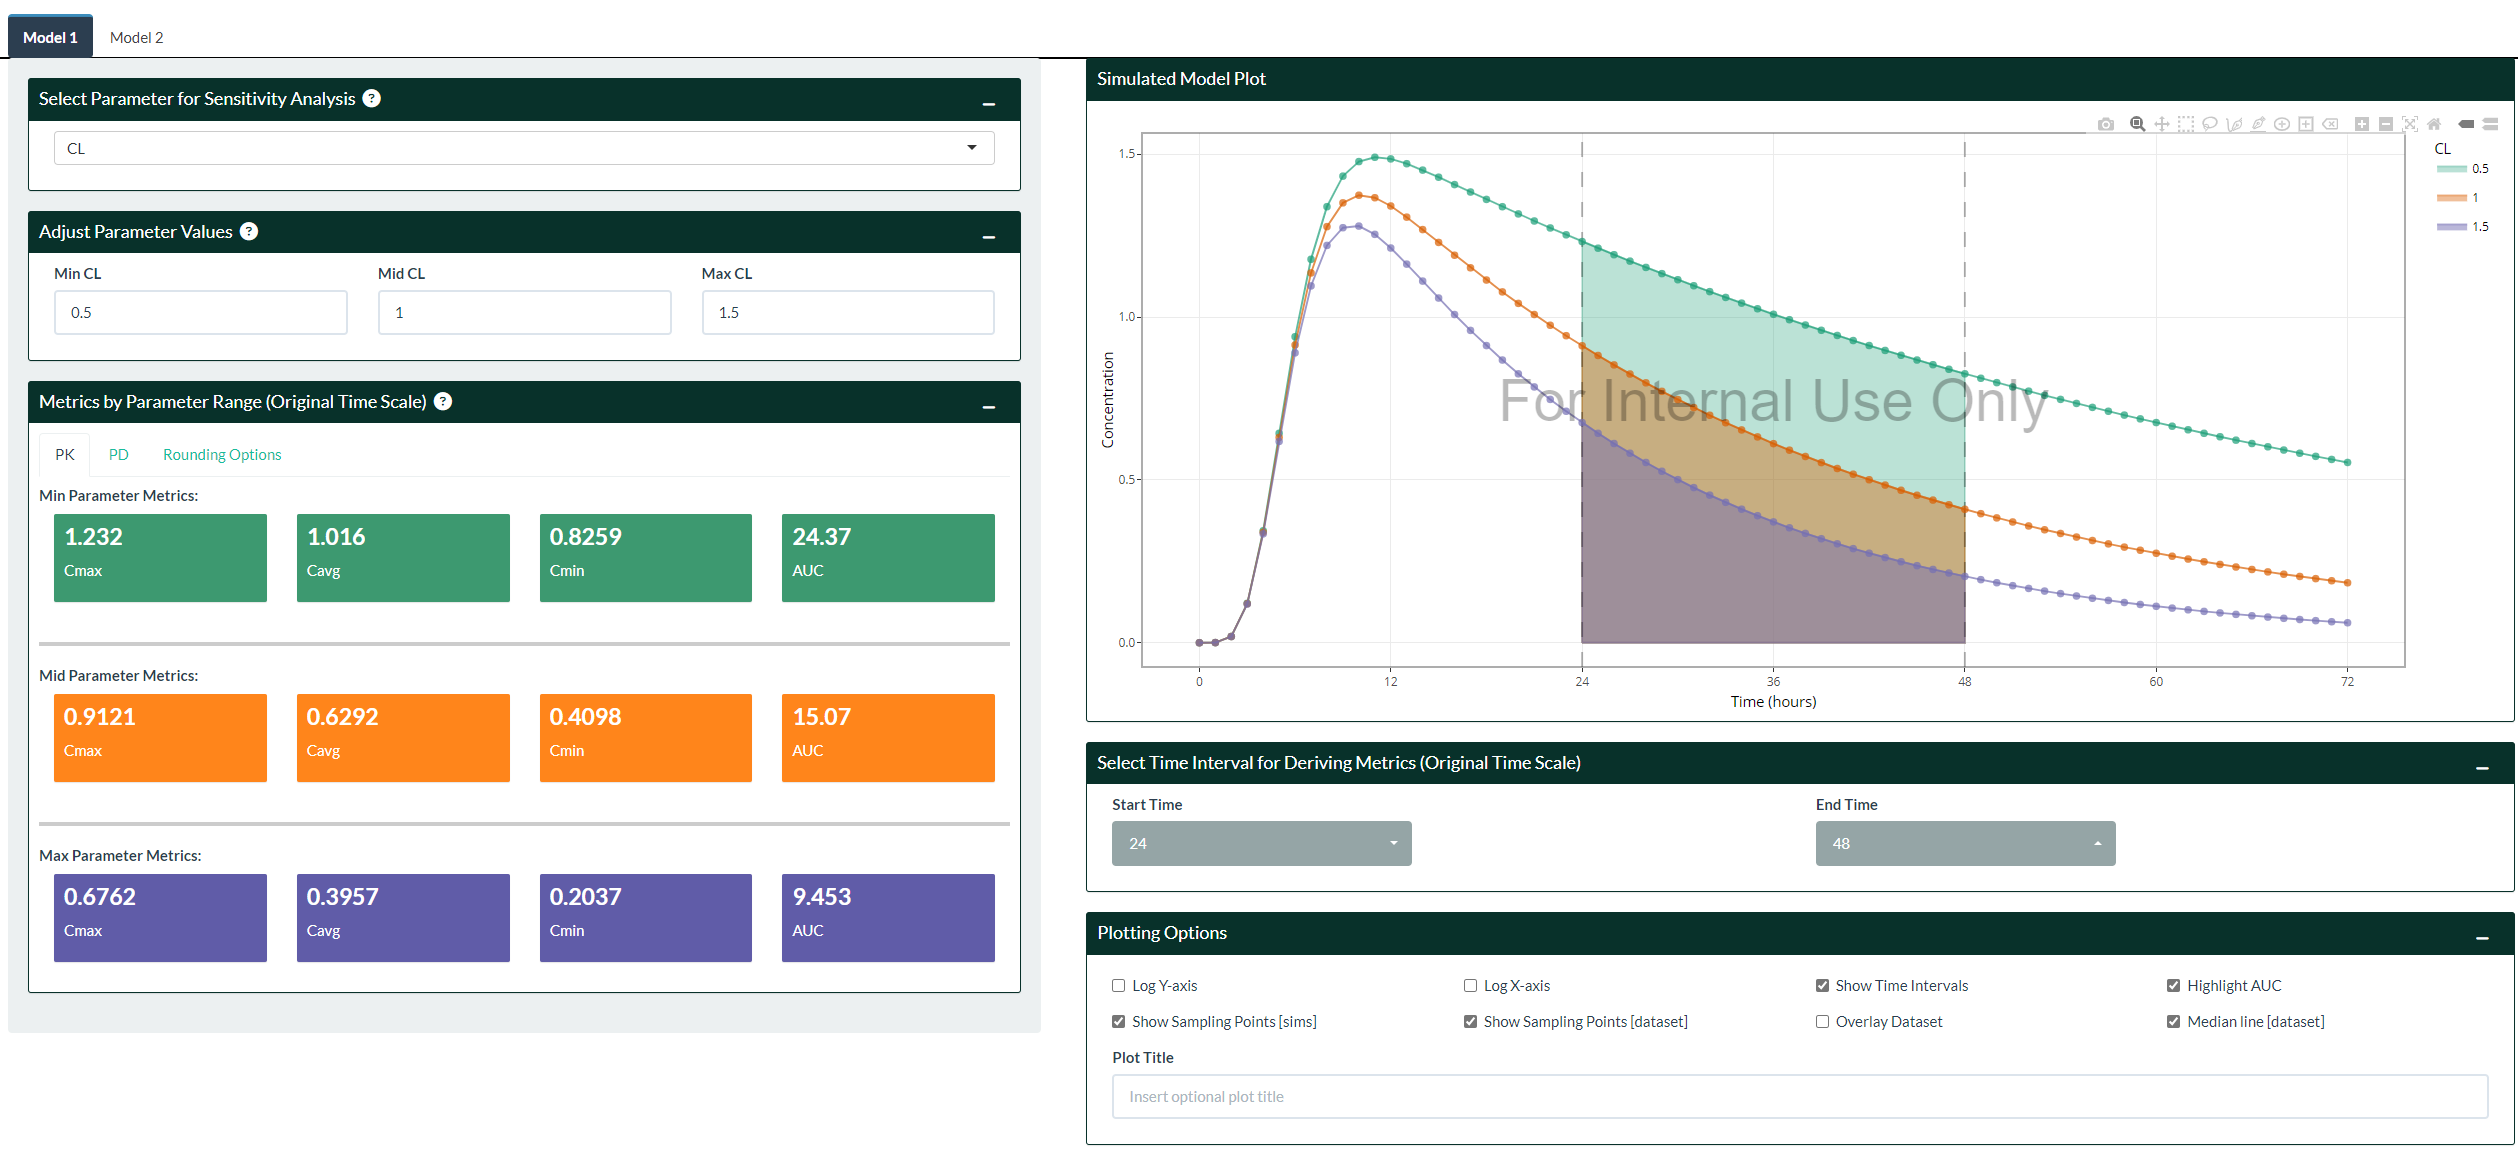
After a model has been generated from the Simulation page, the impact
of perturbing parameter values can be assessed in the Parameter
Sensitivity Analysis. MVP makes this transition seamless by carrying
across previously defined model settings and making them available
(i.e. in $PARAM) for selection.
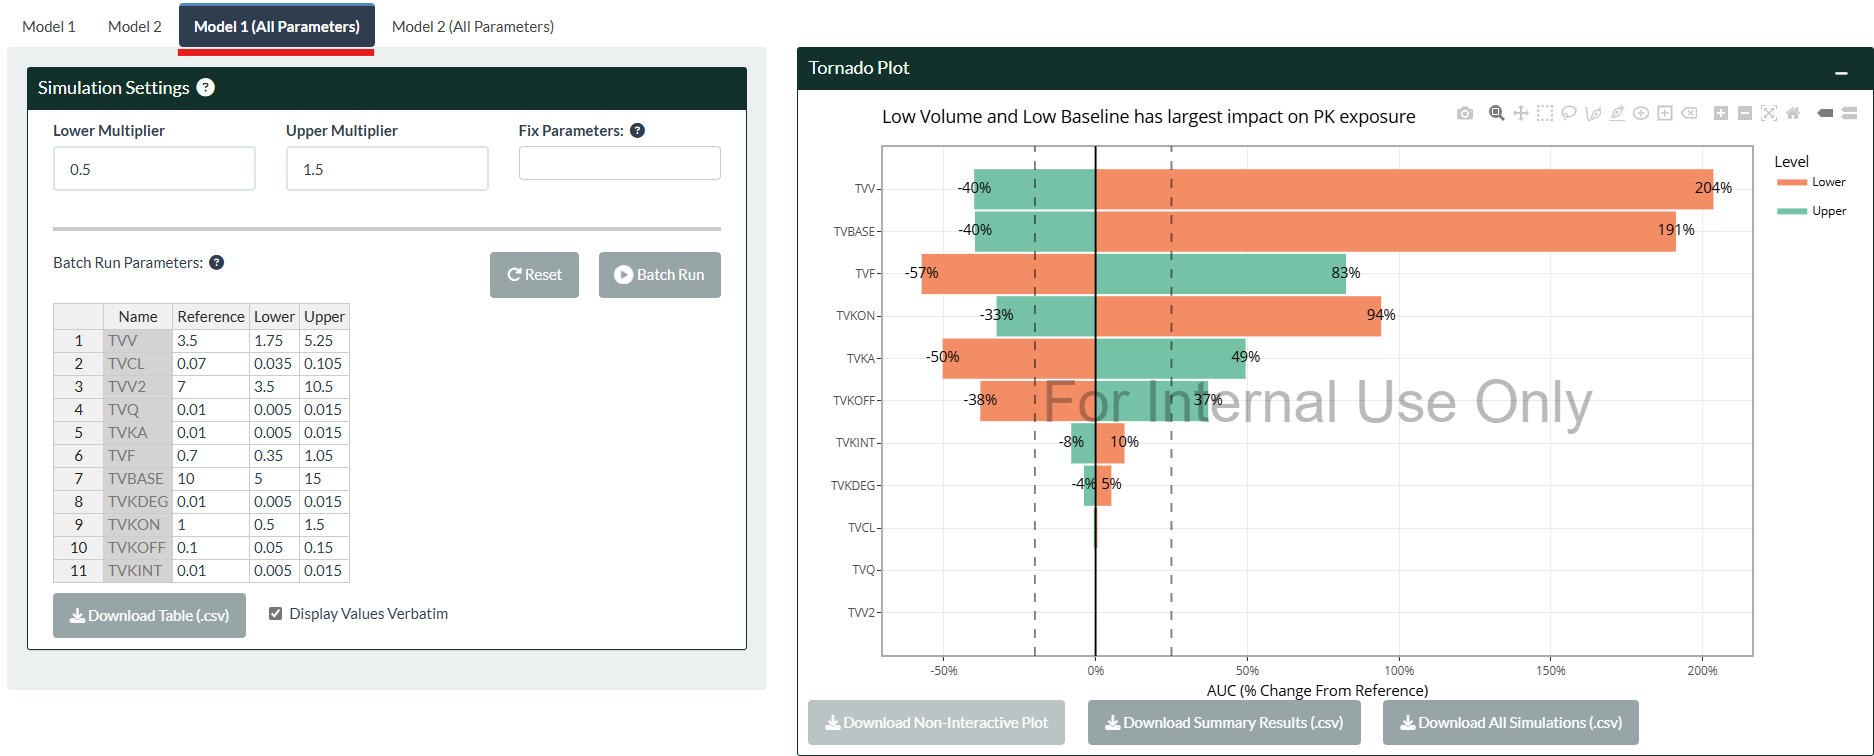
Batch run simulations (i.e. assessing all parameters at the same time) can be generated from the “All Parameters” tab on the top-left side of the page, with results available from just a single click and visualized using Tornado Plots and Spider Plots. This feature is particularly useful for complex models with up to hundreds of parameters to rank parameters of relative importance, e.g. PBPK or QSP models.
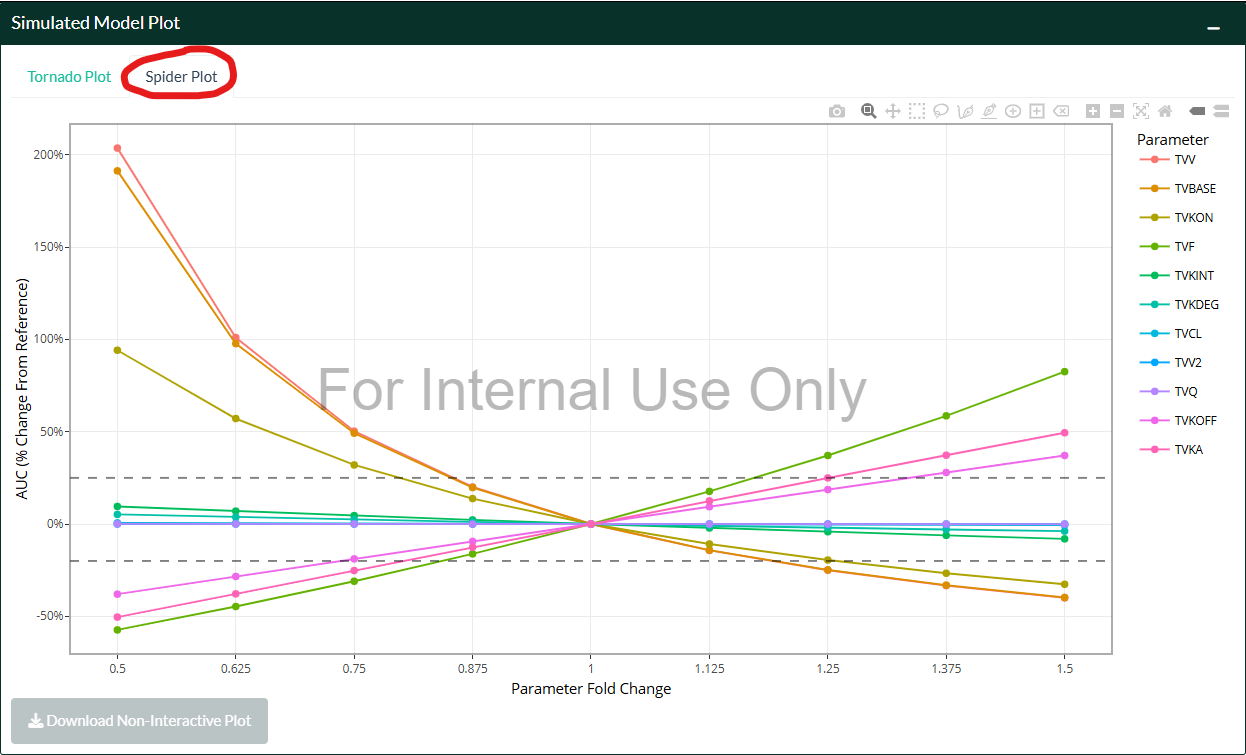
For spider plots (right hand side tab), make sure that the “Gradients” option on the left hand side is checked. 6 additional simulations per parameter will be inserted between the upper and lower bound to provide better “coverage” by increasing the granularity when assessing parameter sensitivity. If the user has large ranges between the upper and lower bound, or has manually edited any parameter value, the “Normalize Fold Change” option may be used for improved visuals.
What makes MVP truly a joy to use is its ease in answering typical
questions such as:
- What are the predicted PK exposures in pediatrics?
- What are the predicted PK exposures within a certain weight
range?
- What are the predicted PK exposures in patients with moderate to
severe renal impairment (or any other covariate where having a
distribution is desired)?
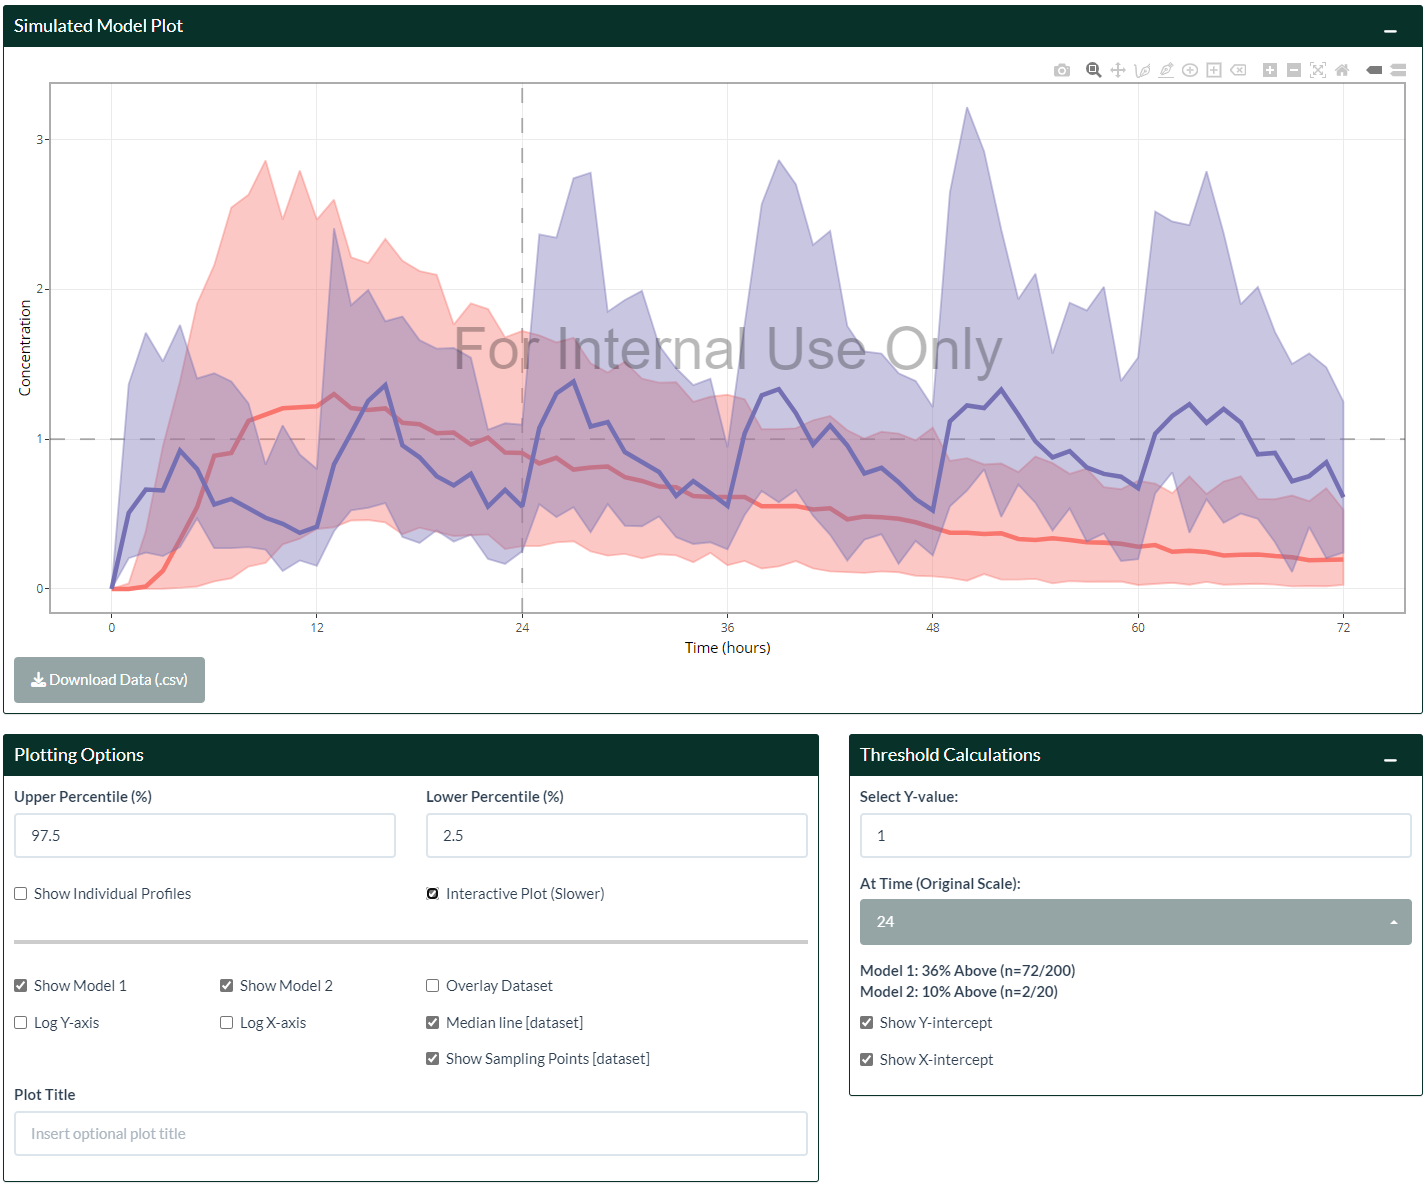
- What is the likelihood of maintaining PD response above a certain
threshold?
- …or a combination of the above questions together!
All of these questions can be handled in MVP in seconds, massively reducing turnaround time from team discussions (or even doing this live)!
AGE, WT,
HT, BMI, or BSA in its
$PARAM section, its value will be replaced
by the subjects’ value from the sampled database.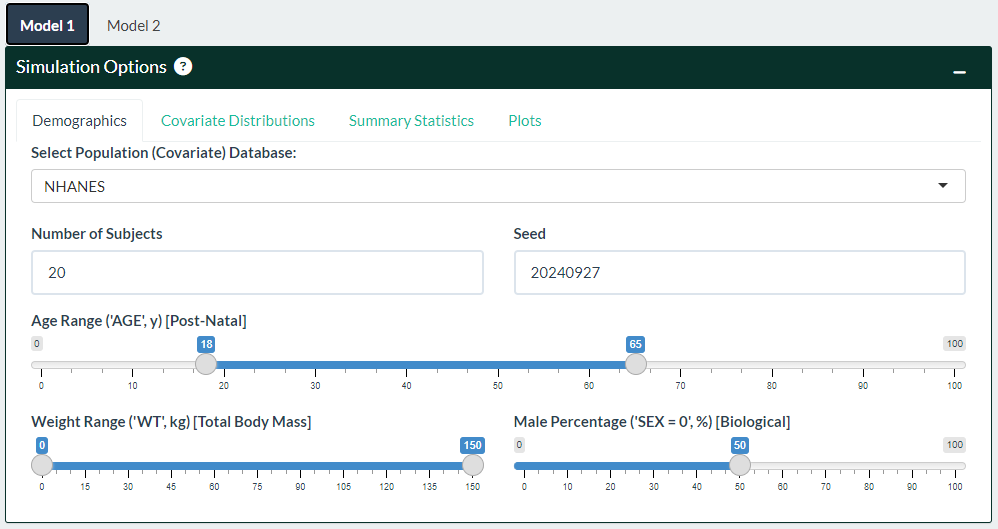
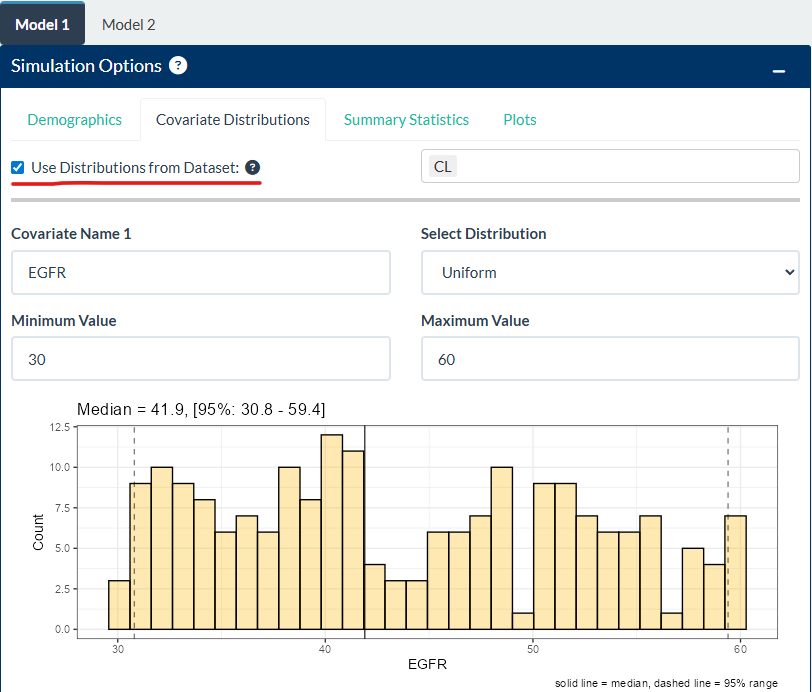
EGFR) and inserted similarly together with the
database shown in step 1). Up to 3 unique covariate distributions are
enabled.
CL
and/or VC can be drawn from the dataset to
replace the corresponding parameter name from the model
code.
Both OMEGAs and SIGMAs, if it exists in the model, will be available
for the user to adjust on the bottom left hand side of the page. Once
ready, click the “Update Model” button to generate new
simulations.
- There are built-in checks to ensure matrices are positive
semi-definite and non-negative, however the user should make sure that
values are sensible. The “Matrix Info” box below should match the
matrices - if not, that means the inputted matrices were invalid and the
matrices has reverted to its last known state.
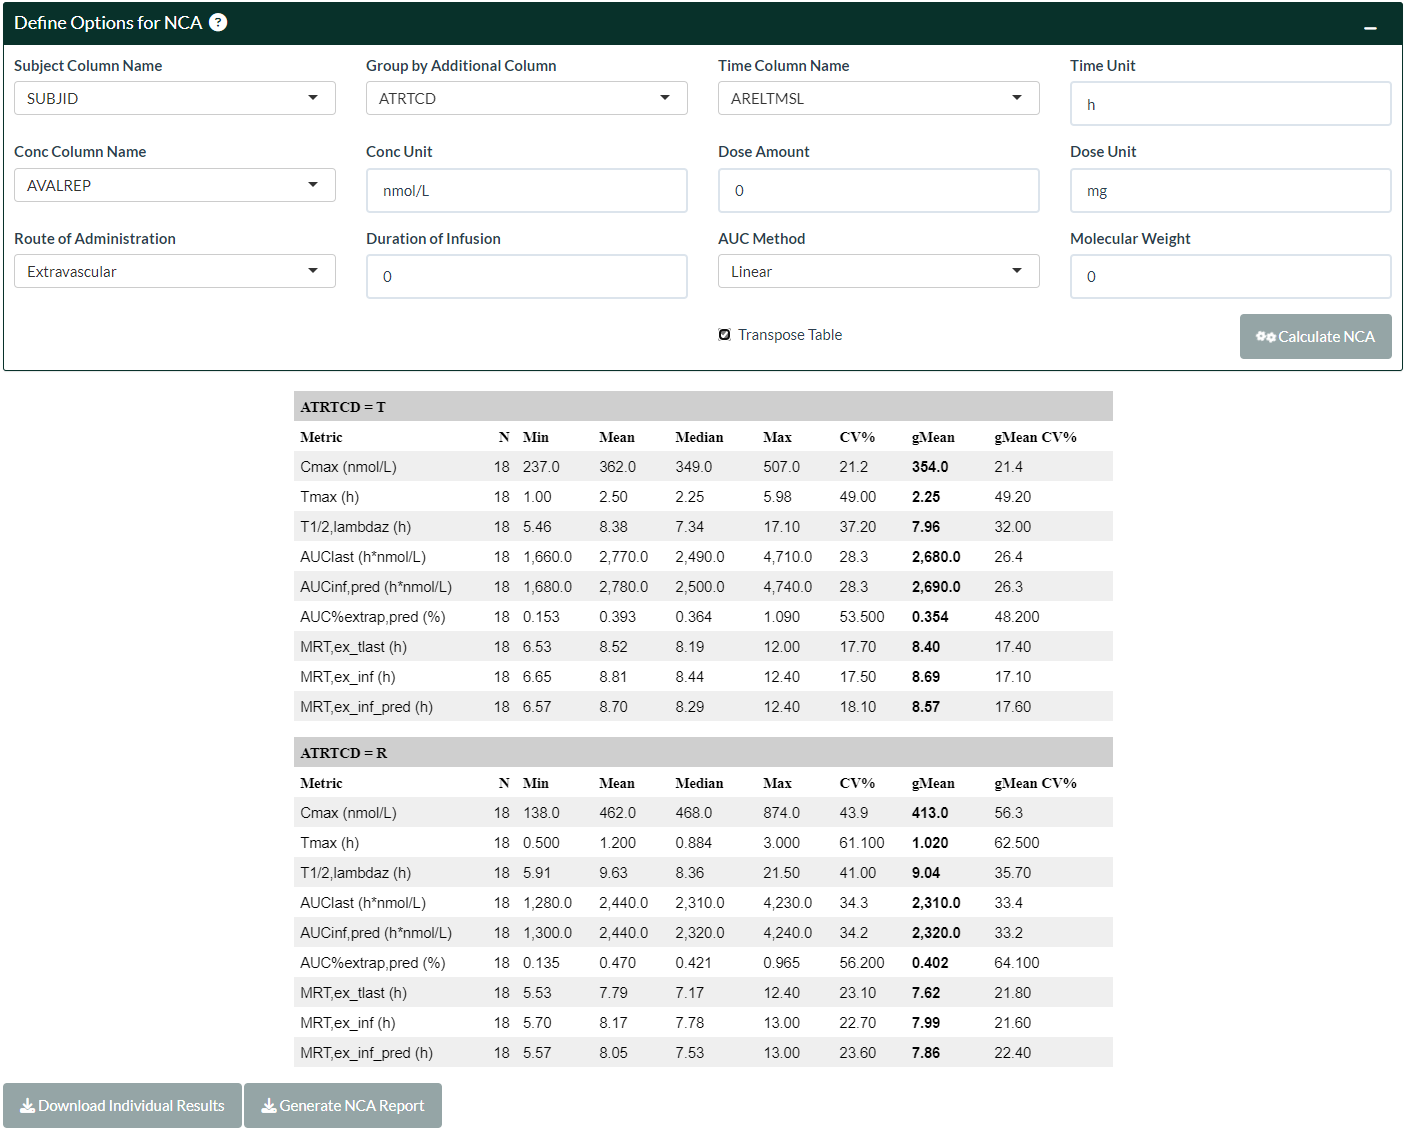
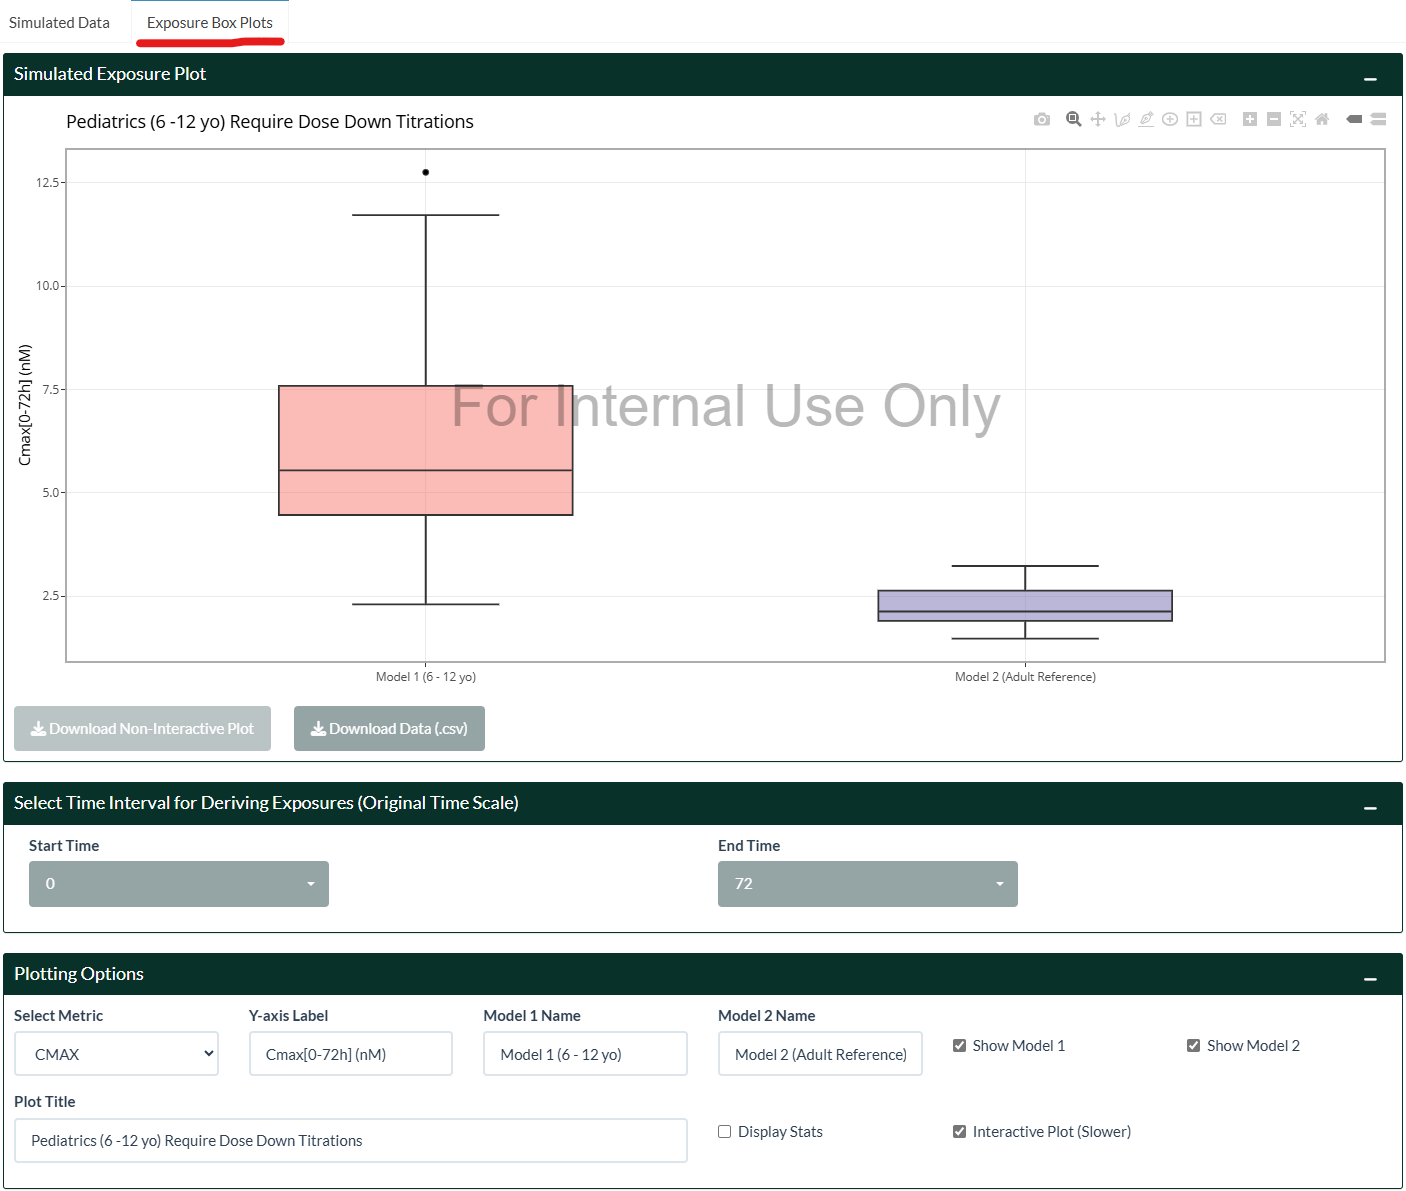
Summary of exposure metrics are readily available to be viewed, which is handy when assessing differences in models, dosing regimens, and/or demographics.
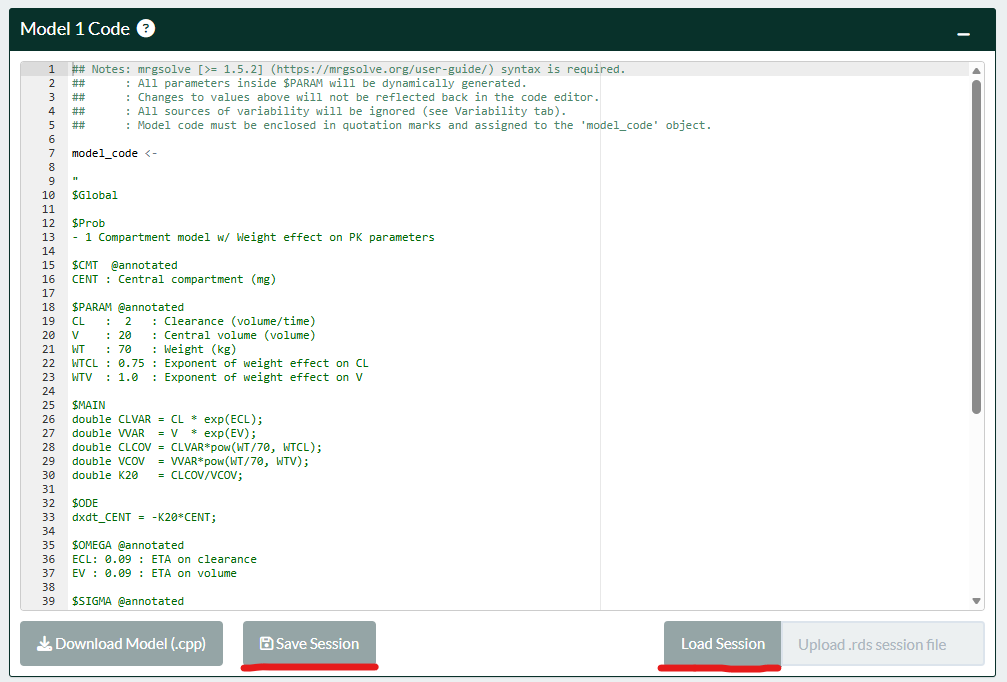
The current model and settings can be saved as a .rds file to be stored locally, and re-loaded at any time for convenience, which includes support of any uploaded datasets and filtering options. The buttons are located below the main code editor. Loading a session restores and runs its model code and data-filtering code automatically, so only load session files from sources you trust.
All relevant model information can be exported as a .zip bundle for local execution to fully reproduce the simulations. A built-in R script is also provided for ease of transfer into the user’s preferred workflow, allowing it to be easily QC’d.
Please see the article on Automatic
Model Translation, or access the vignette on this topic in R
(vignette("automatic-translation", package = "MVPapp")) for
a short guide on how to set up MVP to use generative AI models to
translate any document into mrgsolve, rxode2, or NONMEM code.
Please see the article on Supplying
Passworded Models, or access the vignette on this topic in R
(vignette("supply-passwords", package = "MVPapp")) for
instructions on how to provide external models on App start-up.
Please see the article on Effective
Exploratory Data Analysis (EDA), or access the vignette on this
topic in R
(vignette("data-exploration", package = "MVPapp")) for a
short guide on using MVP to perform quick EDA.
mvp_app() takes the same arguments as
run_mvp() but returns the app instead of launching it. To
deploy MVP, install MVPapp and use an app.R
file containing a single line, for example:
MVPapp::mvp_app(authentication_code = "some_password")The deployment then records the installed MVPapp version
like any other package dependency.
For a company deployment, the title, colour, logo and favicon can be
set at launch without editing any package files. All arguments are
optional; the default (NULL) keeps the standard look.
MVPapp::mvp_app(
  brand_color   = "#F36633",                 # navbar, active tab, panel and table headers, spinners
  brand_logo    = "path/to/company_logo.png", # shown in the navbar in front of the title
  brand_favicon = "path/to/favicon.png",      # browser tab icon
  page_title    = "Company Model Visualization Platform"
)
Image files are read from where they are (they do not need to be
inside the package) and a web URL also works. White or black text is
chosen automatically for readability on brand_color; use
brand_text_color to override it.
The raw data and code used for deriving the populations used in MVP
for the NHANES, CDC, and WHO databases are available inside the
data-raw folder on Github (note: not included as part of
the R-package).
The design aspects of MVP are further discussed in this publication in CPT:PSP, which you may use for citation purposes.
These binaries (installable software) and packages are in development.
They may not be fully stable and should be used with caution. We make no claims about them.