The hardware and bandwidth for this mirror is donated by METANET, the Webhosting and Full Service-Cloud Provider.
If you wish to report a bug, or if you are interested in having us mirror your free-software or open-source project, please feel free to contact us at mirror[@]metanet.ch.
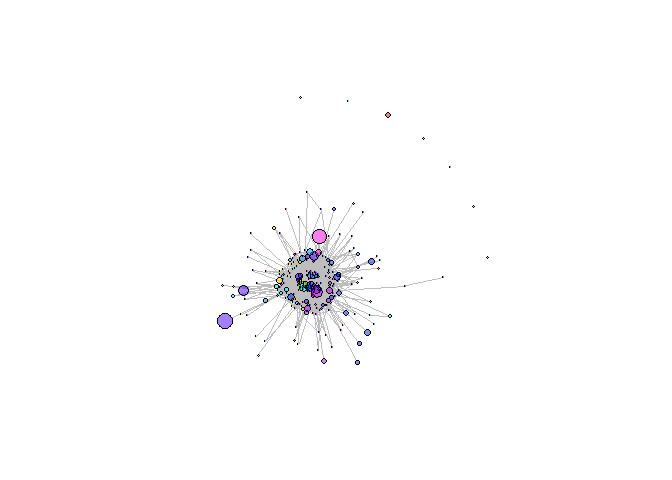
Visualization platform for T cell receptor repertoire analysis output results. It includes comparison of sequence frequency among samples, network of similar sequences and convergent recombination source between species. Currently repertoire analysis is in early stage of development and requires new approaches for repertoire data examination and assessment as we intend to develop.
You can install the development version of RepertoiR from version from GitHub with:
# install.packages("devtools")
devtools::install_github("systemsbiomed/RepertoiR")Creating network graph of TCR repertoire’s clonotypes:
library(RepertoiR)

aa <- c(
  "G", "A", "V", "L", "I", "P", "F", "Y", "W", "S",
  "T", "N", "Q", "C", "M", "D", "E", "H", "K", "R"
)
data <- matrix(rexp(1 / 2, n = 1000), ncol = 4)
cons <- sample(aa, 10)
aavec <- c()

while (length(aavec) < nrow(data)) {
  aaseq <- cons
  index <- sample(length(aaseq), sample(length(aaseq) / 3, 1))
  aaseq[index] <- sample(aa, length(index), replace = TRUE)
  aaseq <- paste0(aaseq, collapse = "")
  aavec <- unique(append(aavec, aaseq))
}

rownames(data) <- aavec
colnames(data) <- LETTERS[1:ncol(data)]
In that case, don’t forget to commit and push the resulting figure files, so they display on GitHub and CRAN.
These binaries (installable software) and packages are in development.
They may not be fully stable and should be used with caution. We make no claims about them.