The hardware and bandwidth for this mirror is donated by METANET, the Webhosting and Full Service-Cloud Provider.
If you wish to report a bug, or if you are interested in having us mirror your free-software or open-source project, please feel free to contact us at mirror[@]metanet.ch.

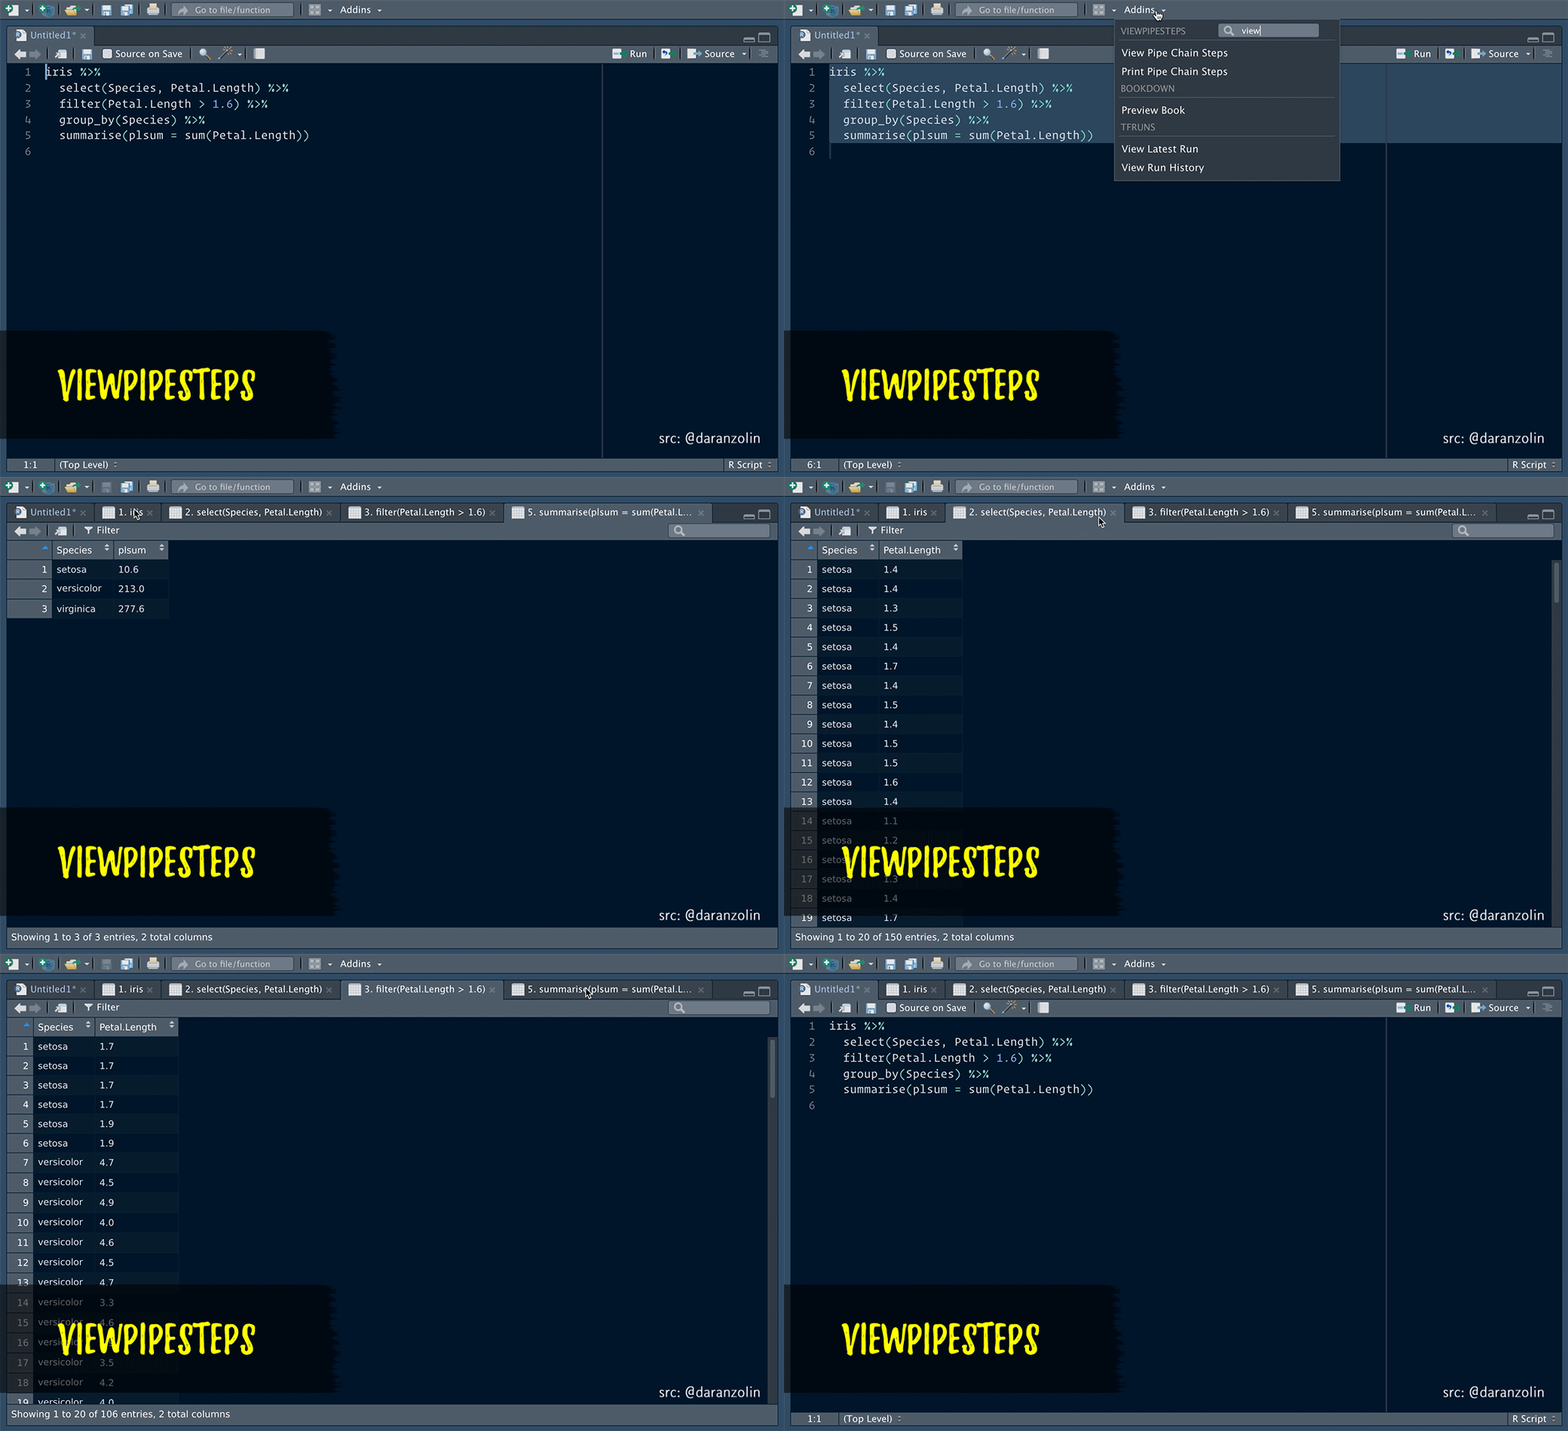
ViewPipeSteps helps to debug pipe chains in a slightly more
elegant fashion. Print/View debugging isn’t sexy, but instead of
manually inserting %>% View() after each step, spice it
up a bit by, e.g., highlighting the entire chain and calling the
viewPipeChain addin:

Thanks to @batpigandme for the the gif!
Alternatively, you can:
printPipeChain addin.diamonds %>%
select(carat, cut, color, clarity, price) %>%
group_by(color) %>%
summarise(n = n(), price = mean(price)) %>%
arrange(desc(color)) %>%
print_pipe_steps() -> result## 1. diamonds
## # A tibble: 53,940 x 10
## carat cut color clarity depth table price x y z
## <dbl> <ord> <ord> <ord> <dbl> <dbl> <int> <dbl> <dbl> <dbl>
## 1 0.23 Ideal E SI2 61.5 55 326 3.95 3.98 2.43
## 2 0.21 Premium E SI1 59.8 61 326 3.89 3.84 2.31
## 3 0.23 Good E VS1 56.9 65 327 4.05 4.07 2.31
## 4 0.290 Premium I VS2 62.4 58 334 4.2 4.23 2.63
## 5 0.31 Good J SI2 63.3 58 335 4.34 4.35 2.75
## 6 0.24 Very Good J VVS2 62.8 57 336 3.94 3.96 2.48
## 7 0.24 Very Good I VVS1 62.3 57 336 3.95 3.98 2.47
## 8 0.26 Very Good H SI1 61.9 55 337 4.07 4.11 2.53
## 9 0.22 Fair E VS2 65.1 61 337 3.87 3.78 2.49
## 10 0.23 Very Good H VS1 59.4 61 338 4 4.05 2.39
## # … with 53,930 more rows
## 2. select(carat, cut, color, clarity, price)
## # A tibble: 53,940 x 5
## carat cut color clarity price
## <dbl> <ord> <ord> <ord> <int>
## 1 0.23 Ideal E SI2 326
## 2 0.21 Premium E SI1 326
## 3 0.23 Good E VS1 327
## 4 0.290 Premium I VS2 334
## 5 0.31 Good J SI2 335
## 6 0.24 Very Good J VVS2 336
## 7 0.24 Very Good I VVS1 336
## 8 0.26 Very Good H SI1 337
## 9 0.22 Fair E VS2 337
## 10 0.23 Very Good H VS1 338
## # … with 53,930 more rows
## 4. summarise(n = n(), price = mean(price))
## # A tibble: 7 x 3
## color n price
## <ord> <int> <dbl>
## 1 D 6775 3170.
## 2 E 9797 3077.
## 3 F 9542 3725.
## 4 G 11292 3999.
## 5 H 8304 4487.
## 6 I 5422 5092.
## 7 J 2808 5324.
## 5. arrange(desc(color))
## # A tibble: 7 x 3
## color n price
## <ord> <int> <dbl>
## 1 J 2808 5324.
## 2 I 5422 5092.
## 3 H 8304 4487.
## 4 G 11292 3999.
## 5 F 9542 3725.
## 6 E 9797 3077.
## 7 D 6775 3170.%P>% pipe
variant that prints the output of the pipe’s left hand side prior to
piping it to the right hand side.diamonds %>%
select(carat, cut, color, clarity, price) %>%
group_by(color) %>%
summarise(n = n(), price = mean(price)) %P>%
arrange(desc(color)) -> result## Printing diamonds %>% select(carat, cut, color, clarity, price) %>% group_by(color) %>% summarise(n = n(), price = mean(price))
## # A tibble: 7 x 3
## color n price
## <ord> <int> <dbl>
## 1 D 6775 3170.
## 2 E 9797 3077.
## 3 F 9542 3725.
## 4 G 11292 3999.
## 5 H 8304 4487.
## 6 I 5422 5092.
## 7 J 2808 5324.devtools::install_github("daranzolin/ViewPipeSteps")Check tools/test_cases.R for more elaborate examples.
These binaries (installable software) and packages are in development.
They may not be fully stable and should be used with caution. We make no claims about them.