The hardware and bandwidth for this mirror is donated by METANET, the Webhosting and Full Service-Cloud Provider.
If you wish to report a bug, or if you are interested in having us mirror your free-software or open-source project, please feel free to contact us at mirror[@]metanet.ch.

“animbook” is a package to help the user visualize the changes in performance measures and demographic affiliations using animation. It is a package to help prepare, plot, and animate the data.
You can install the development version of animbook from GitHub with:
install.packages("animbook")library(animbook)
library(dplyr)data <- osiris |>
filter(country %in% c("US", "JP"))
label <- c("Top 25%", "25-50", "50-75", "75-100", "Not listed")
accounting <- anim_prep(data,
id = ID,
values = sales,
time = year,
label = label,
ncat = 4,
group = country)
p <- wallaby_plot(accounting,
group_palette = RColorBrewer::brewer.pal(9, "Set1"),
shade_palette = c("#777777", "#777777", "#777777",
"#777777", "#777777"),
subset = "bottom",
relation = "many_one",
height = 1,
size = 2,
width = 100,
total_point = 1000)
#> You can now use the animbook::anim_animate() function to
#> transform it into an animated object
p2 <- anim_animate(p)
#> You can now pass it to gganimate::animate().
#> The recommended setting is nframes = 139
gganimate::animate(p2)
All the companies in the Top 25% were US companies. Any Japanese companies in the Top 25% in 2006 did not exit the market (Not listed). It is worth noting that in 2006, there were no Japanese companies in the Top 25%. It is also interesting that a large proportion of companies in the Top 25% are being de-listed, and the lower the quartile, the less likely the companies are to exit the market.
library(animbook)

voter <- anim_prep_cat(data = aeles,
                       id = id,
                       values = party,
                       time = year,
                       group = gender,
                       order = NULL)

p_voter <- wallaby_plot(data = voter,
                  group_palette = c("pink", "blue", "red"),
                  shade_palette = c("#777777", "#777777", "#777777",
                                    "#777777", "#777777", "#777777"),
                  time_dependent = FALSE,
                  rendering = "gganimate",
                  subset = "top",
                  relation = "one_many",
                  height = 1,
                  size = 2.5,
                  width = 100,
                  total_point = 1000)
#> You can now use the animbook::anim_animate() function to
#>           transform it into an animated object

p2_voter <- anim_animate(p_voter)
#> You can now pass it to gganimate::animate().
#>                    The recommended setting is nframes = 139

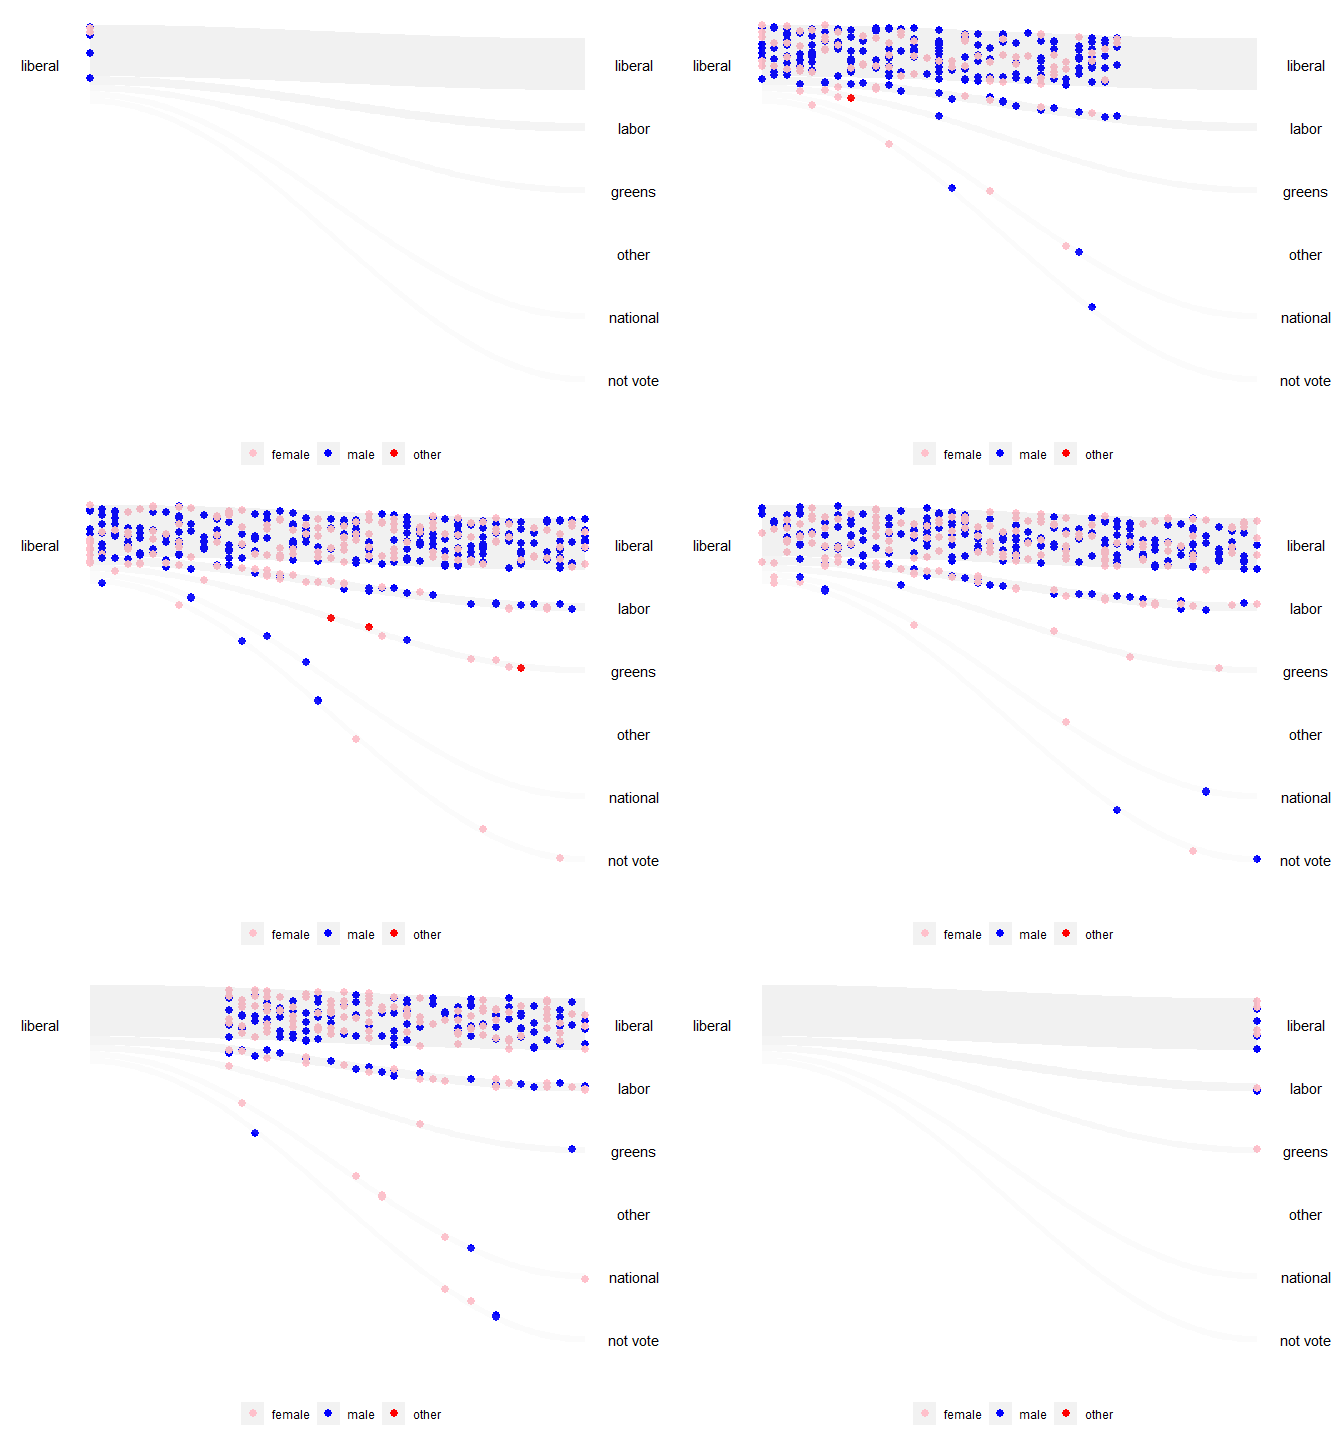
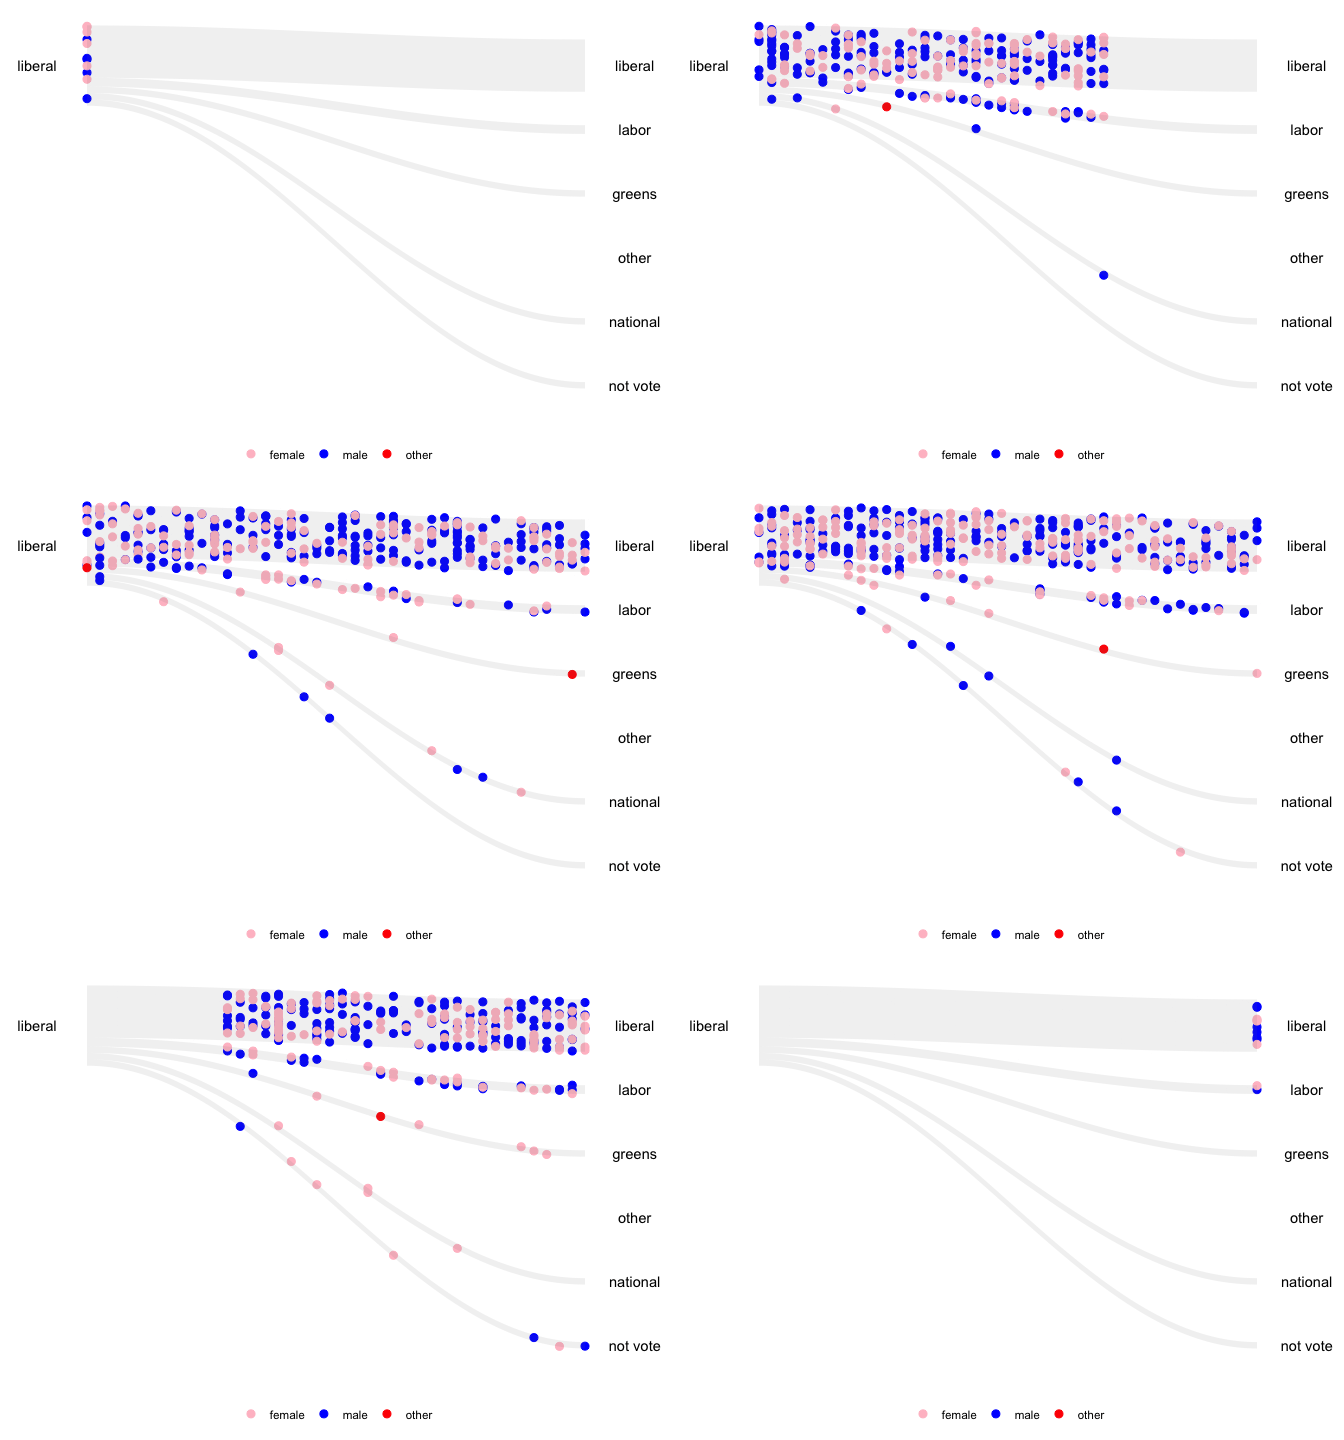
gganimate::animate(p2_voter)
It reveals a pattern where individuals who identified their gender as ‘others’ have shifted their voting preference from the Liberal Party, the leading party in 2006, to the Greens Party.
These binaries (installable software) and packages are in development.
They may not be fully stable and should be used with caution. We make no claims about them.