The hardware and bandwidth for this mirror is donated by METANET, the Webhosting and Full Service-Cloud Provider.
If you wish to report a bug, or if you are interested in having us mirror your free-software or open-source project, please feel free to contact us at mirror[@]metanet.ch.
autodb is an R package for automatic normalisation of a data frame to third normal form, with the intention of easing the process of data cleaning. (Usage to design your actual database for you is not advised.)
Install the stable released version from CRAN with:
install.packages("autodb")Install the unstable development version from GitHub with:
# install.packages("devtools")
devtools::install_github("CharnelMouse/autodb")Turning a simple data frame into a database:
library(autodb)
#>
#> Attaching package: 'autodb'
#> The following object is masked from 'package:stats':
#>
#> decompose
summary(ChickWeight)
#> weight Time Chick Diet
#> Min. : 35.0 Min. : 0.00 13 : 12 1:220
#> 1st Qu.: 63.0 1st Qu.: 4.00 9 : 12 2:120
#> Median :103.0 Median :10.00 20 : 12 3:120
#> Mean :121.8 Mean :10.72 10 : 12 4:118
#> 3rd Qu.:163.8 3rd Qu.:16.00 17 : 12
#> Max. :373.0 Max. :21.00 19 : 12
#> (Other):506
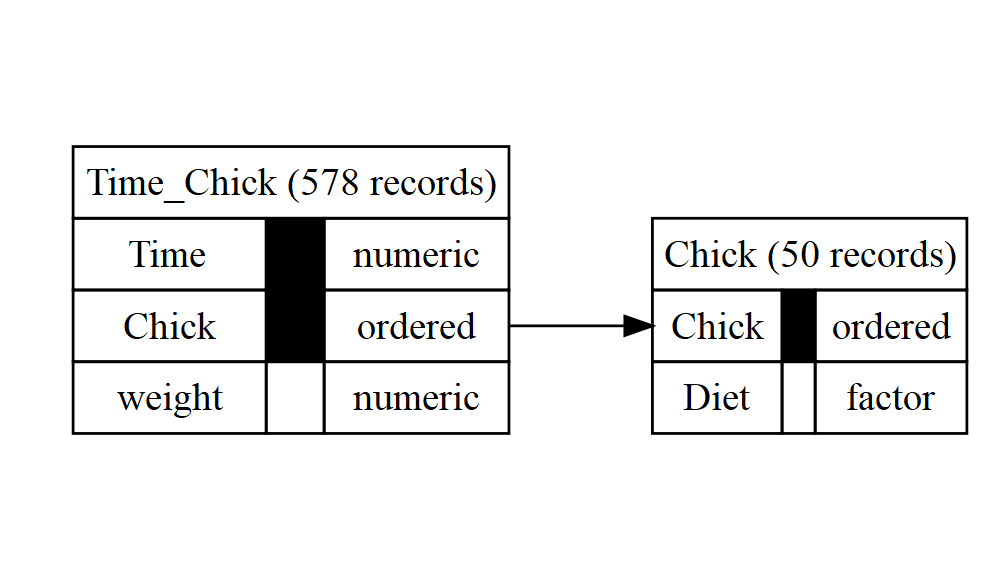
db <- autodb(ChickWeight)
db
#> database with 2 relations
#> 4 attributes: weight, Time, Chick, Diet
#> relation Chick: Chick, Diet; 50 records
#> key 1: Chick
#> relation Time_Chick: Time, Chick, weight; 578 records
#> key 1: Time, Chick
#> references:
#> Time_Chick.{Chick} -> Chick.{Chick}
graphviz_text <- gv(db)
DiagrammeR::grViz(graphviz_text)
Using the exclude argument to forbid certain variables
from appearing in keys:
summary(CO2)
#>      Plant             Type         Treatment       conc          uptake
#>  Qn1    : 7   Quebec     :42   nonchilled:42   Min.   :  95   Min.   : 7.70
#>  Qn2    : 7   Mississippi:42   chilled   :42   1st Qu.: 175   1st Qu.:17.90
#>  Qn3    : 7                                    Median : 350   Median :28.30
#>  Qc1    : 7                                    Mean   : 435   Mean   :27.21
#>  Qc3    : 7                                    3rd Qu.: 675   3rd Qu.:37.12
#>  Qc2    : 7                                    Max.   :1000   Max.   :45.50
#>  (Other):42
db2_noexclude <- autodb(CO2)
db2_noexclude
#> database with 3 relations
#> 5 attributes: Plant, Type, Treatment, conc, uptake
#> relation Plant: Plant, Type, Treatment; 12 records
#>   key 1: Plant
#> relation Plant_conc: Plant, conc, Treatment, uptake; 84 records
#>   key 1: Plant, conc
#>   key 2: Treatment, conc, uptake
#> relation conc_uptake: conc, uptake, Type; 82 records
#>   key 1: conc, uptake
#> references:
#> Plant_conc.{Plant} -> Plant.{Plant}
#> Plant_conc.{conc, uptake} -> conc_uptake.{conc, uptake}
graphviz_text2_noexclude <- gv(db2_noexclude)
DiagrammeR::grViz(graphviz_text2_noexclude)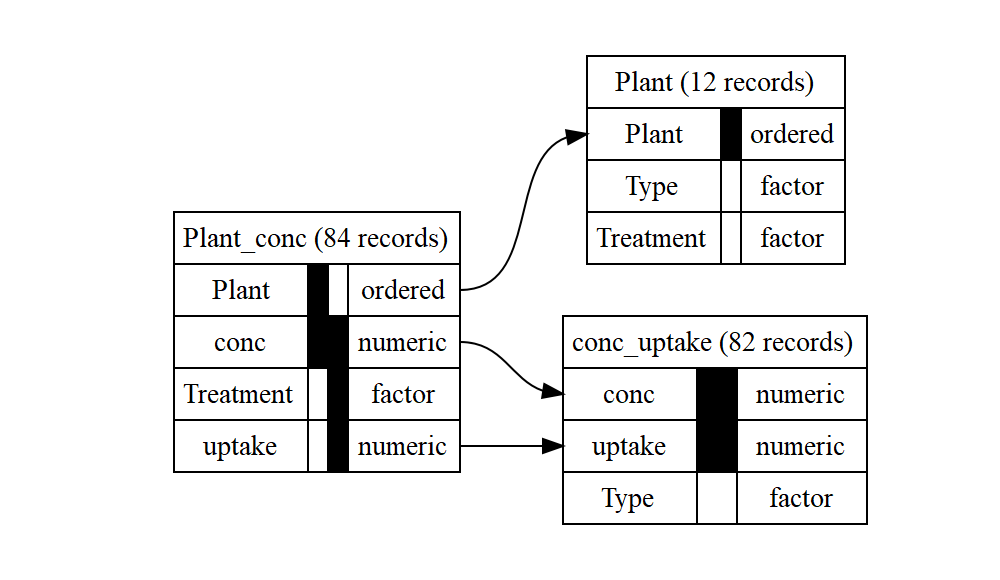
db2 <- autodb(CO2, exclude = "uptake")
db2
#> database with 2 relations
#> 5 attributes: Plant, Type, Treatment, conc, uptake
#> relation Plant: Plant, Type, Treatment; 12 records
#>   key 1: Plant
#> relation Plant_conc: Plant, conc, uptake; 84 records
#>   key 1: Plant, conc
#> references:
#> Plant_conc.{Plant} -> Plant.{Plant}
graphviz_text2 <- gv(db2)
DiagrammeR::grViz(graphviz_text2)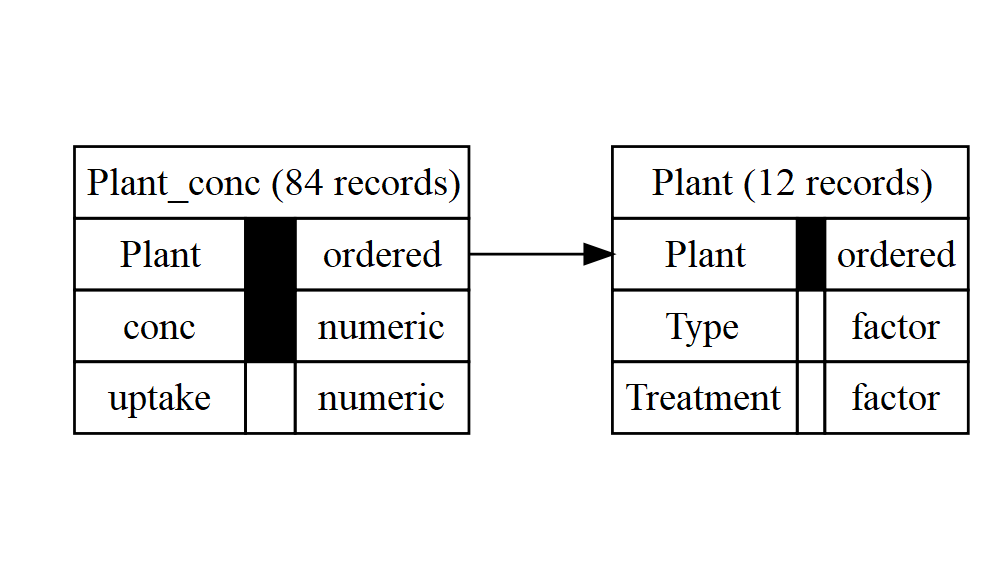
There are also functions for doing each step of the database creation separately, including functional dependency detection and normalisation. See the vignette for more details.
These binaries (installable software) and packages are in development.
They may not be fully stable and should be used with caution. We make no claims about them.