The hardware and bandwidth for this mirror is donated by METANET, the Webhosting and Full Service-Cloud Provider.
If you wish to report a bug, or if you are interested in having us mirror your free-software or open-source project, please feel free to contact us at mirror[@]metanet.ch.

Intense parallel workloads can be difficult to monitor. Packages crew.cluster,
clustermq,
and future.batchtools
distribute hundreds of worker processes over multiple computers. If a
worker process exhausts its available memory, it may terminate silently,
leaving the underlying problem difficult to detect or troubleshoot.
Using the autometric package, a worker can proactively
monitor itself in a detached POSIX thread. The worker process itself
runs normally, and the thread writes to a log every few seconds. If the
worker terminates unexpectedly, autometric can read and
visualize the log file to reveal potential resource-related reasons for
the crash.
You can install the development version of autometric
from GitHub with:
remotes::install_github("wlandau/autometric")The log_start() function in autometric
starts a non-blocking POSIX thread to write resource usage statistics to
a log at periodic intervals. The following example uses the callr R package to
launch a resource-intensive background process on a Unix-like system.
The autometric thread prints to standard output, and
callr directs all its standard output to a temporary text
file we define in advance.1 Custom calls to
log_phase_set() annotate the log data2.
log_file <- tempfile()

process <- callr::r_bg(
  func = function() {
    library(autometric)
    log_phase_set("setup")
    log_start(
      path = "/dev/stdout",
      pids = c(my_worker = Sys.getpid()),
      seconds = 1
    )

    log_phase_set("warmup")
    Sys.sleep(3)

    print("You can mix printed messages with regular log data.")

    print("Defining a function that guzzles CPU power.")
    is_prime <- function(n) {
      if (n <= 1) return(FALSE)
      for (i in seq(2, sqrt(n))) {
        if (n %% i == 0) {
          return(FALSE)
        }
      }
      TRUE
    }

    log_phase_set("large object")
    x <- rnorm(1e8)

    log_phase_set("heavy cpu")
    lapply(seq_len(1e6), is_prime)

    log_phase_set("another object")
    y <- rnorm(1e8)

    log_phase_set("more cpu")
    lapply(seq_len(1e6), is_prime)

    log_phase_set("third object")
    z <- rnorm(1e8)

    log_phase_set("done")
  },
  stdout = log_file
)
When we read in the log file, we see messages from both R and the
autometric thread.
writeLines(readLines(log_file))
#> __AUTOMETRIC__|0.1.0|50454|my_worker|0|1730312985.355|0.800|0.080|81707008|420736614400|warmup|__AUTOMETRIC__
#> __AUTOMETRIC__|0.1.0|50454|my_worker|0|1730312986.360|0.000|0.000|81707008|420736614400|warmup|__AUTOMETRIC__
#> [1] "You can mix printed messages with regular log data."
#> [1] "Defining a function that guzzles CPU power."
#> __AUTOMETRIC__|0.1.0|50454|my_worker|0|1730312987.361|0.000|0.000|81788928|420745003008|large object|__AUTOMETRIC__
#> __AUTOMETRIC__|0.1.0|50454|my_worker|0|1730312988.367|98.200|9.820|384761856|421545033728|large object|__AUTOMETRIC__
#> __AUTOMETRIC__|0.1.0|50454|my_worker|0|1730312989.372|99.300|9.930|551337984|421545033728|large object|__AUTOMETRIC__
#> __AUTOMETRIC__|0.1.0|50454|my_worker|0|1730312990.377|99.100|9.910|505069568|421553422336|heavy cpu|__AUTOMETRIC__
#> __AUTOMETRIC__|0.1.0|50454|my_worker|0|1730312991.378|100.000|10.000|339132416|421561810944|heavy cpu|__AUTOMETRIC__
#> __AUTOMETRIC__|0.1.0|50454|my_worker|0|1730312992.380|99.300|9.930|332136448|421561810944|heavy cpu|__AUTOMETRIC__
#> __AUTOMETRIC__|0.1.0|50454|my_worker|0|1730312993.385|100.000|10.000|291848192|421561810944|heavy cpu|__AUTOMETRIC__
#> __AUTOMETRIC__|0.1.0|50454|my_worker|0|1730312994.390|100.000|10.000|272302080|421561810944|heavy cpu|__AUTOMETRIC__
#> __AUTOMETRIC__|0.1.0|50454|my_worker|0|1730312995.395|100.000|10.000|221003776|421561810944|heavy cpu|__AUTOMETRIC__
#> __AUTOMETRIC__|0.1.0|50454|my_worker|0|1730312996.400|100.000|10.000|154877952|421561810944|heavy cpu|__AUTOMETRIC__
#> __AUTOMETRIC__|0.1.0|50454|my_worker|0|1730312997.403|99.200|9.920|178995200|422361825280|another object|__AUTOMETRIC__
#> __AUTOMETRIC__|0.1.0|50454|my_worker|0|1730312998.405|100.000|10.000|475480064|422361825280|another object|__AUTOMETRIC__
#> __AUTOMETRIC__|0.1.0|50454|my_worker|0|1730312999.410|99.500|9.950|733970432|422361825280|another object|__AUTOMETRIC__
#> __AUTOMETRIC__|0.1.0|50454|my_worker|0|1730313000.415|98.000|9.800|682590208|422361825280|more cpu|__AUTOMETRIC__
#> __AUTOMETRIC__|0.1.0|50454|my_worker|0|1730313001.416|100.000|10.000|479789056|422361825280|more cpu|__AUTOMETRIC__
#> __AUTOMETRIC__|0.1.0|50454|my_worker|0|1730313002.421|99.600|9.960|340885504|422361825280|more cpu|__AUTOMETRIC__
#> __AUTOMETRIC__|0.1.0|50454|my_worker|0|1730313003.426|100.000|10.000|120291328|422361825280|more cpu|__AUTOMETRIC__
#> __AUTOMETRIC__|0.1.0|50454|my_worker|0|1730313004.432|99.700|9.970|124502016|422361825280|more cpu|__AUTOMETRIC__
#> __AUTOMETRIC__|0.1.0|50454|my_worker|0|1730313005.437|98.200|9.820|125583360|422361825280|more cpu|__AUTOMETRIC__
#> __AUTOMETRIC__|0.1.0|50454|my_worker|0|1730313006.442|99.700|9.970|125386752|422361825280|more cpu|__AUTOMETRIC__
#> __AUTOMETRIC__|0.1.0|50454|my_worker|0|1730313007.444|98.200|9.820|261177344|423161839616|third object|__AUTOMETRIC__
#> __AUTOMETRIC__|0.1.0|50454|my_worker|0|1730313008.447|99.500|9.950|564985856|423161839616|third object|__AUTOMETRIC__
#> __AUTOMETRIC__|0.1.0|50454|my_worker|0|1730313009.452|100.000|10.000|602243072|423161839616|third object|__AUTOMETRIC__
autometric knows how to read its log entries even if the
log file has other messages. See the documentation of
log_read() to learn how to interpret the data and customize
the measurement units.
library(autometric)
log_data <- log_read(log_file)

log_data
#>    version          phase   pid      name status   time  core   cpu  resident
#> 1    0.1.0         warmup 50454 my_worker      0  0.000   0.8  0.08  81.70701
#> 2    0.1.0         warmup 50454 my_worker      0  1.005   0.0  0.00  81.70701
#> 3    0.1.0   large object 50454 my_worker      0  2.006   0.0  0.00  81.78893
#> 4    0.1.0   large object 50454 my_worker      0  3.012  98.2  9.82 384.76186
#> 5    0.1.0   large object 50454 my_worker      0  4.017  99.3  9.93 551.33798
#> 6    0.1.0      heavy cpu 50454 my_worker      0  5.022  99.1  9.91 505.06957
#> 7    0.1.0      heavy cpu 50454 my_worker      0  6.023 100.0 10.00 339.13242
#> 8    0.1.0      heavy cpu 50454 my_worker      0  7.025  99.3  9.93 332.13645
#> 9    0.1.0      heavy cpu 50454 my_worker      0  8.030 100.0 10.00 291.84819
#> 10   0.1.0      heavy cpu 50454 my_worker      0  9.035 100.0 10.00 272.30208
#> 11   0.1.0      heavy cpu 50454 my_worker      0 10.040 100.0 10.00 221.00378
#> 12   0.1.0      heavy cpu 50454 my_worker      0 11.045 100.0 10.00 154.87795
#> 13   0.1.0 another object 50454 my_worker      0 12.048  99.2  9.92 178.99520
#> 14   0.1.0 another object 50454 my_worker      0 13.050 100.0 10.00 475.48006
#> 15   0.1.0 another object 50454 my_worker      0 14.055  99.5  9.95 733.97043
#> 16   0.1.0       more cpu 50454 my_worker      0 15.060  98.0  9.80 682.59021
#> 17   0.1.0       more cpu 50454 my_worker      0 16.061 100.0 10.00 479.78906
#> 18   0.1.0       more cpu 50454 my_worker      0 17.066  99.6  9.96 340.88550
#> 19   0.1.0       more cpu 50454 my_worker      0 18.071 100.0 10.00 120.29133
#> 20   0.1.0       more cpu 50454 my_worker      0 19.077  99.7  9.97 124.50202
#> 21   0.1.0       more cpu 50454 my_worker      0 20.082  98.2  9.82 125.58336
#> 22   0.1.0       more cpu 50454 my_worker      0 21.087  99.7  9.97 125.38675
#> 23   0.1.0   third object 50454 my_worker      0 22.089  98.2  9.82 261.17734
#> 24   0.1.0   third object 50454 my_worker      0 23.092  99.5  9.95 564.98586
#> 25   0.1.0   third object 50454 my_worker      0 24.097 100.0 10.00 602.24307
#>     virtual
#> 1  420736.6
#> 2  420736.6
#> 3  420745.0
#> 4  421545.0
#> 5  421545.0
#> 6  421553.4
#> 7  421561.8
#> 8  421561.8
#> 9  421561.8
#> 10 421561.8
#> 11 421561.8
#> 12 421561.8
#> 13 422361.8
#> 14 422361.8
#> 15 422361.8
#> 16 422361.8
#> 17 422361.8
#> 18 422361.8
#> 19 422361.8
#> 20 422361.8
#> 21 422361.8
#> 22 422361.8
#> 23 423161.8
#> 24 423161.8
#> 25 423161.8
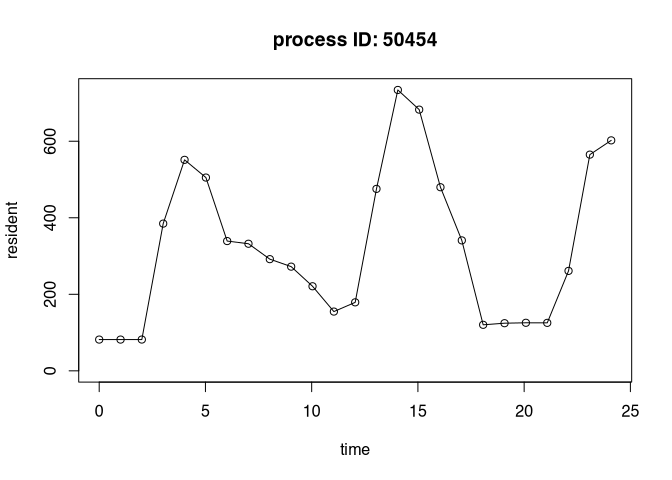
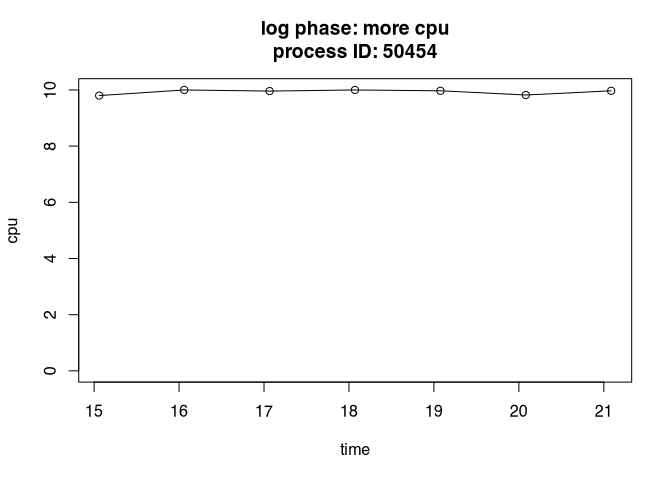
autometric also supports simple visualizations plot
performance metrics over time. To avoid depending on many other R
packages, autometric only uses base plotting functionality.
Feel free to create fancier visualizations directly with ggplot2.
log_plot(log_data, metric = "resident")
log_plot(log_data, phase = "more cpu", metric = "cpu")
autometric heavily leverages fantastic work on the ps R package by Jay Loden,
Dave Daeschler, Giampaolo Rodola, Gábor Csárdi, and Posit Software, PBC.
The source code of ps
was especially helpful for identifying appropriate system calls to
retrieve resource usage statistics. Attribution is given in the
Authors@R field of the DESCRIPTION file, the
LICENSE.note file at the top level of the package, and in
the comments of the C files in src/. Please visit https://github.com/r-lib/ps/blob/main/LICENSE.md to view
the license of ps. ps in turn is based on psutil,
whose license is available at https://github.com/giampaolo/psutil/blob/master/LICENSE.
Please note that the autometric project is released with
a Contributor Code of Conduct:
https://contributor-covenant.org/version/2/1/CODE_OF_CONDUCT.html.
By contributing to this project, you agree to abide by its terms.
Logging to standard output is useful on clusters like SLURM where workers already redirect standard output to log files, or on the cloud where a service like Amazon CloudWatch captures messages instead of directing them to a physical file.↩︎
See also log_phase_get()
and log_phase_reset()↩︎
These binaries (installable software) and packages are in development.
They may not be fully stable and should be used with caution. We make no claims about them.