The hardware and bandwidth for this mirror is donated by METANET, the Webhosting and Full Service-Cloud Provider.
If you wish to report a bug, or if you are interested in having us mirror your free-software or open-source project, please feel free to contact us at mirror[@]metanet.ch.
Bayesian additive regression trees (BART) estimate a regression function as a sum of small trees, so nonlinearity and interactions are found rather than specified. bartisan does that for response distributions that standard BART cannot reach, using the Laplace-approximation reversible-jump sampler of Linero (2025), which relaxes the requirement that the leaf parameters be integrable in closed form. That requirement ties standard BART to a Gaussian likelihood. Relaxing it generalizes BART much as a generalized linear model extends linear regression: the analyst can choose the response distribution.
Models are specified with a formula, a data frame, and a family, just
as in glm(). bartisan accepts standard
stats::family objects without modification. Beyond them
come the families that have no glm() counterpart: negative
binomial, ordinal, multinomial, beta and ordered beta, zero-inflated
counts, a Tweedie compound Poisson, accelerated failure time and
proportional hazards models for right-censored times, location-scale
regression, a Dirichlet process mixture for the error distribution, and
a log density written as an R function. Decision rules are smooth by
default, in the manner of Linero and Yang (2018), which fits a smoother function than
the step functions of standard BART.
bartisan supports varying-coefficient models, where the effect of a predictor receives its own forest, a special case of which is the Bayesian causal forest (BCF) model for estimating treatment effects. Along with this is an interface for estimating average treatment effects from BART and BCF models. In addition, bartisan supports random intercepts BART models.
Integration is provided with the future and progressr packages for parallel processing and progress bars.
You can install the current stable version of bartisan from CRAN with:
install.packages("bartisan")You can install the development version of bartisan from GitHub with:
# install.packages("pak")
pak::pak("ngreifer/bartisan")
Installing from source, which the development version always requires, compiles C++ and so needs a C++17 toolchain.
The rhc dataset in bartisan holds 1500
critically ill patients from the SUPPORT study, recording whether each
was given right heart catheterization on admission to intensive care,
whether they died during follow-up, and thirteen covariates measured
beforehand (Connors et al. 1996). Fitting
a model to it takes one call, and the family is the one
glm() would be given:
library(bartisan)

data("rhc")
set.seed(123)

fit <- bartisan(death ~ rhc + age + sex + race + edu + pafi +
                  paco2 + crea + surv2m + card,
                data = rhc, family = binomial())

fit
#> Generalized BART
#>
#> Call:
#> bartisan(formula = death ~ rhc + age + sex + race + edu + pafi +
#>     paco2 + crea + surv2m + card, data = rhc, family = binomial())
#>
#> Family: "binomial" with the "logit" link
#> Observations: 1500
#> Structure: 1 forest of 50 trees, soft decision rules
#> Draws: 800 kept after 200 warmup
Calling summary() on the fit gives a quick check of
convergence and the predictors used most often to split the trees, and
points to the functions that examine each of these in full:
summary(fit)
#> Convergence and mixing
#>
#> Log likelihood: R-hat 1.039, bulk ESS 98, tail ESS 185, over 1 chain
#>
#> ℹ Use diagnose() (`?bartisan::diagnose`) to examine convergence and mixing
#>   diagnostics.
#>
#> Variable importance
#>
#> Predictors ranked by use; 5 of 10 shown.
#>  variable prop_used prop_splits splits
#>    surv2m         1       0.141   10.6
#>       age         1       0.109    8.3
#>     paco2         1       0.109    8.2
#>       edu         1       0.095    7.2
#>       sex         1       0.093    7.0
#>
#> ℹ Use variable_importance() (`?bartisan::variable_importance`) to examine
#>   variable importance.
#>
#> Further tools
#>
#> ℹ Use loo() (`?bartisan::loo.bartisan_fit`) to compare this fit with others, or
#>   kfold() (`?bartisan::kfold.bartisan_fit`) if `loo()` reports many Pareto k
#>   values above 0.7.
#> ℹ Use partial_dependence() (`?bartisan::partial_dependence`) and plot()
#>   (`?bartisan::plot.bartisan_fit`) to view the partial dependence of the
#>   predictions on a predictor.
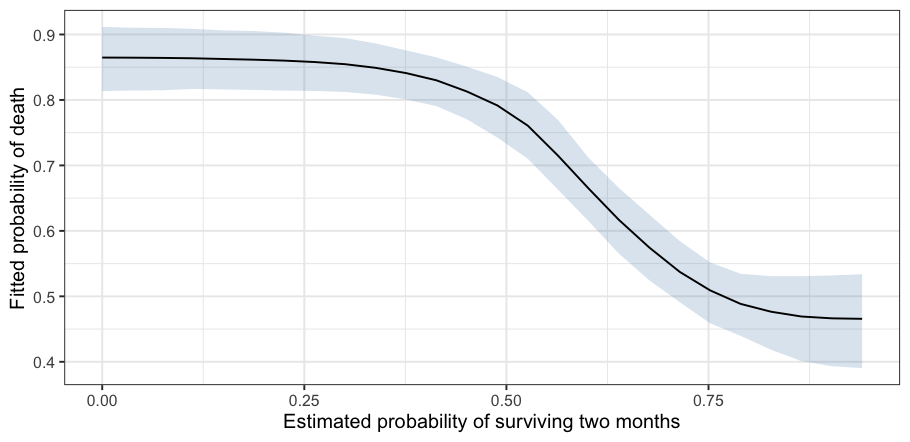
Nothing had to be specified about which predictors matter, which are
curved, or which interact. plot() after
partial_dependence() shows what the model made of one of
them, here the study’s own estimate of each patient’s chance of
surviving two months:
partial_dependence(fit, ~ surv2m) |>
  plot() +
  ggplot2::labs(x = "Estimated probability of surviving two months",
                y = "Fitted probability of death")
A forest has no coefficients, so an effect is a contrast between what the model predicts under one value of a predictor and under another, averaged over the sample. Every posterior draw goes through that contrast, so what comes back is a credible interval rather than a standard error:
estimate_effect(fit, treat = "rhc")
#> Average treatment effect (difference)
#>
#> Treatment: `rhc`
#> Averaged over 1500 units
#>
#>     contrast estimate  lower upper    n
#>  Y[1] - Y[0]    0.064 0.0143  0.11 1500
#>
#> Average potential outcomes
#>
#>  quantity estimate lower upper
#>      Y[0]    0.631 0.602 0.659
#>      Y[1]    0.695 0.656 0.732
#>
#> ℹ estimate is the posterior mean; lower and upper bound the 95% equal-tailed
#>   credible interval.
#> ℹ Y[a] is the average response with `rhc` set to "a".
To examine effect heterogeneity, one can generate a plot of conditional effect estimates for all units:
estimate_effect(fit, treat = "rhc", estimand = "CATE") |>
  plot()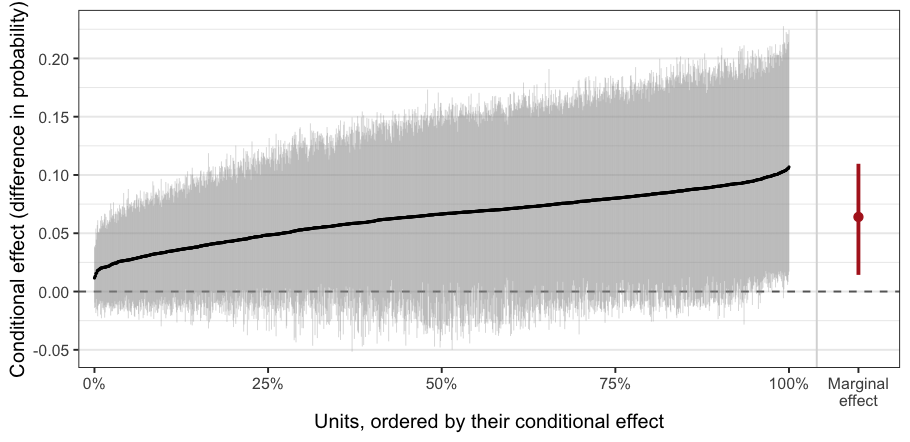
vignette("bartisan") is the place to start. It carries
one analysis from the formula through to the estimates, and each of its
sections points at the guide that takes that step further:
| Topic | Vignette |
|---|---|
| Choosing a response family | vignette("families") |
| Censored and survival outcomes | vignette("survival") |
| Varying coefficient models | vignette("varying") |
| Effects, curves, and interactions | vignette("effects") |
| Which predictors the model uses | vignette("importance") |
| Convergence and model fit | vignette("diagnostics") |
| Comparing and selecting models | vignette("comparison") |
| Causal inference and Bayesian causal forests | vignette("causal") |
| What the model is and how it is fitted | vignette("implementation") |
| Short answers to common questions | vignette("faq") |
A fitted model also works with the packages that already read Bayesian fits: marginaleffects for a wider range of estimands, loo for model comparison, bayesplot and posterior for the draws themselves, and performance for fit statistics. Load one and call its functions on the fit; there is nothing to set up.
bartisan implements the sampler of Linero (2025), and its MCMC engine is adapted from
that paper’s FlexBart reference implementation. Please cite
the method and the package both, the latter with its version number,
which citation("bartisan") supplies. The smooth decision
rules are those of Linero and Yang (2018).
Both papers are listed under References below.
Please file an issue at https://github.com/ngreifer/bartisan/issues, with a reproducible example where the report concerns a fit.
These binaries (installable software) and packages are in development.
They may not be fully stable and should be used with caution. We make no claims about them.