

The hardware and bandwidth for this mirror is donated by METANET, the Webhosting and Full Service-Cloud Provider.
If you wish to report a bug, or if you are interested in having us mirror your free-software or open-source project, please feel free to contact us at mirror[@]metanet.ch.
Remove Weekends and Holidays From ggplot2 Axes
Ask Yahoo Finance for S&P prices, use those as past NYSE trading
dates. Then create some fake prices, put them into a
data.frame alongside the dates:
data(nyse)
set.seed(12345)
df <- data.frame(date=nyse, price=cumsum(rnorm(length(nyse))) + 100)Create a plot:
library(dplyr)
library(ggplot2)
plot <- df %>% filter(as.Date('2014-08-01') <= date & date <= as.Date('2014-10-08')) %>%
ggplot(aes(x=date, y=price)) + geom_step() +
theme(axis.title.x=element_blank(), axis.title.y=element_blank())
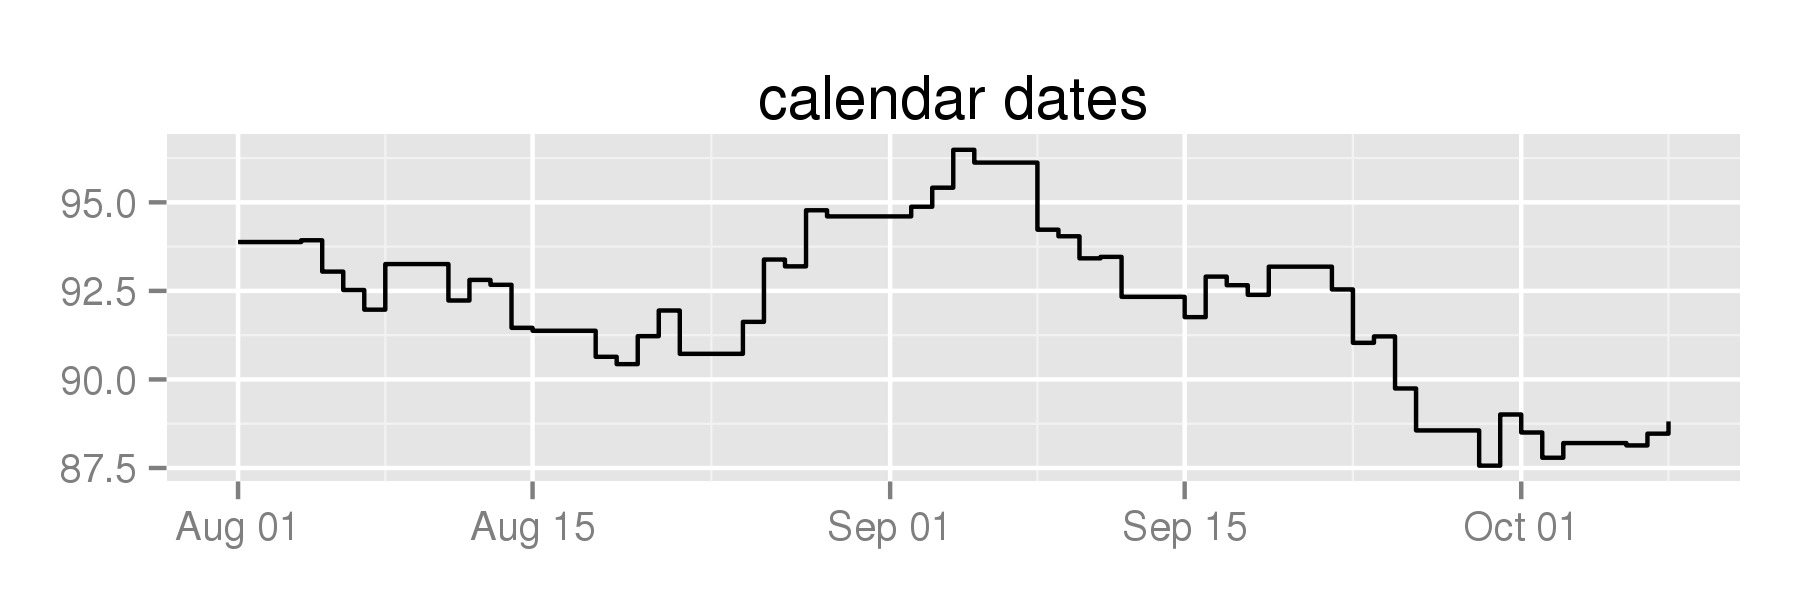
plot + ggtitle('calendar dates')Note the large gap at the beginning of September, because Labor Day was on the 1st:
Plot against scale_x_bd instead:
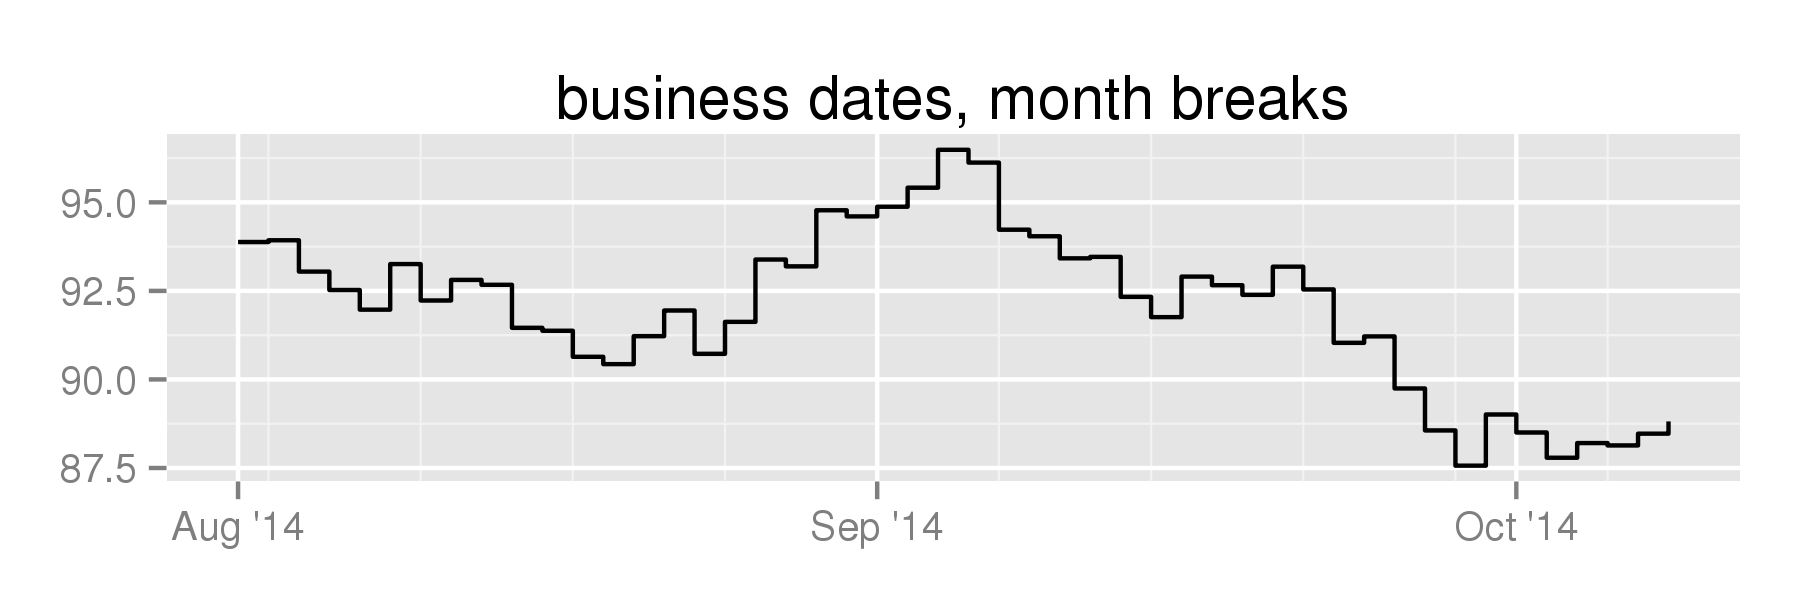
plot + scale_x_bd(business.dates=nyse, labels=date_format("%b '%y")) +
  ggtitle('business dates, month breaks')
Removes weekends and holidays from the graph:
The major breaks are pretty far apart, on the first trading day of each month.
It’s a wide chart, tell it to use more breaks:
plot + scale_x_bd(business.dates=nyse, max.major.breaks=10, labels=date_format('%b %d')) +
  ggtitle('business dates, week breaks')
Given that max, it determines it can put major breaks on the first trading day of the week, and minor breaks every day:

Say I wanted to put vertical lines on option expiration dates.
Calling as.numeric on my dates translates them into the
the number of calendar days after the unix epoch, which is what
scale_x_date uses (see
scales:::from_date):
options <- c('2014-08-15', '2014-09-19') %>% as.Date

plot +
  geom_vline(xintercept=as.numeric(options), size=2, alpha=0.25) +
  ggtitle('calendar dates, option expiry')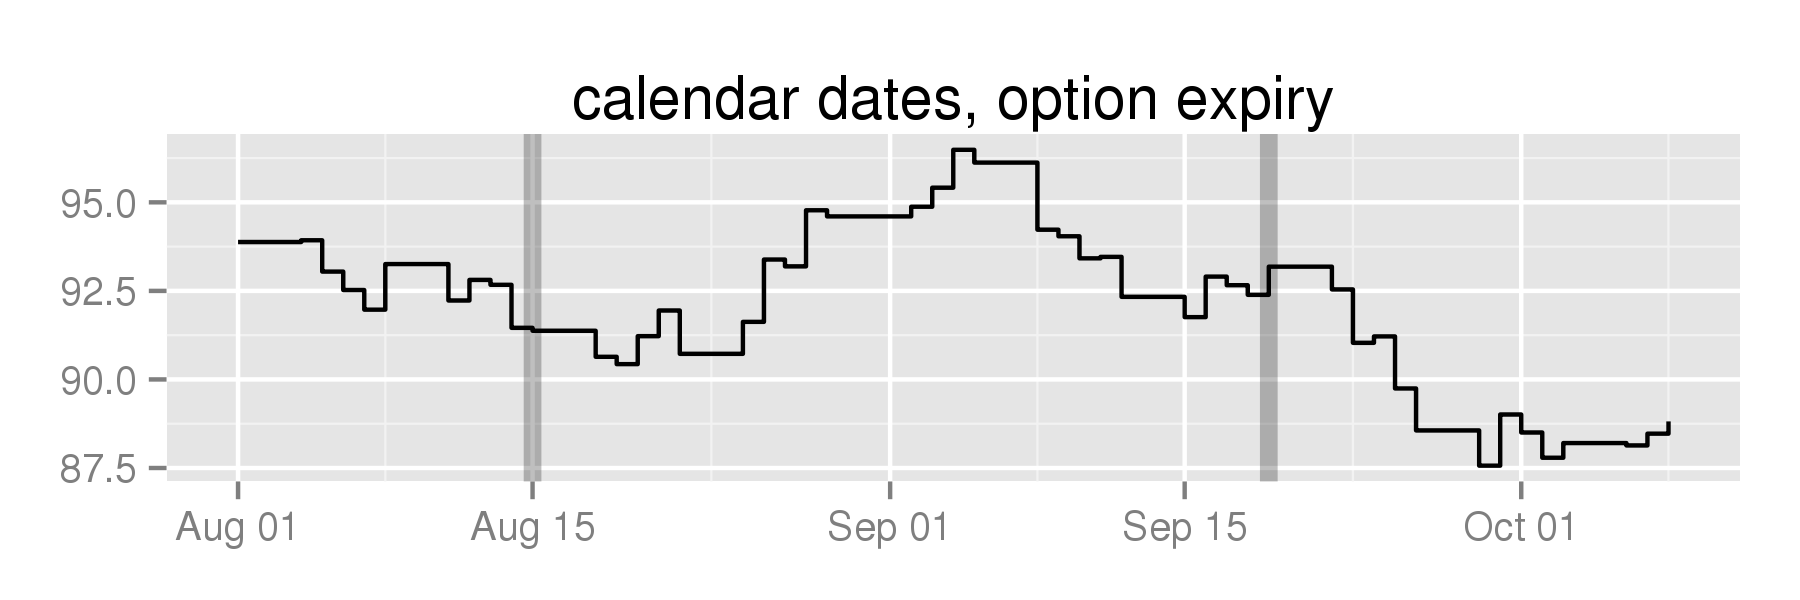
This doesn’t work for business-day space because the x-axis now
represents the number of business days after the first date in your
business.dates vector.
Instead, use the bdscale::bd2t function to translate
into business-day space:
plot +
  geom_vline(xintercept=bd2t(options, business.dates=nyse), size=2, alpha=0.25) +
  scale_x_bd(business.dates=nyse) +
  ggtitle('business dates, option expiry')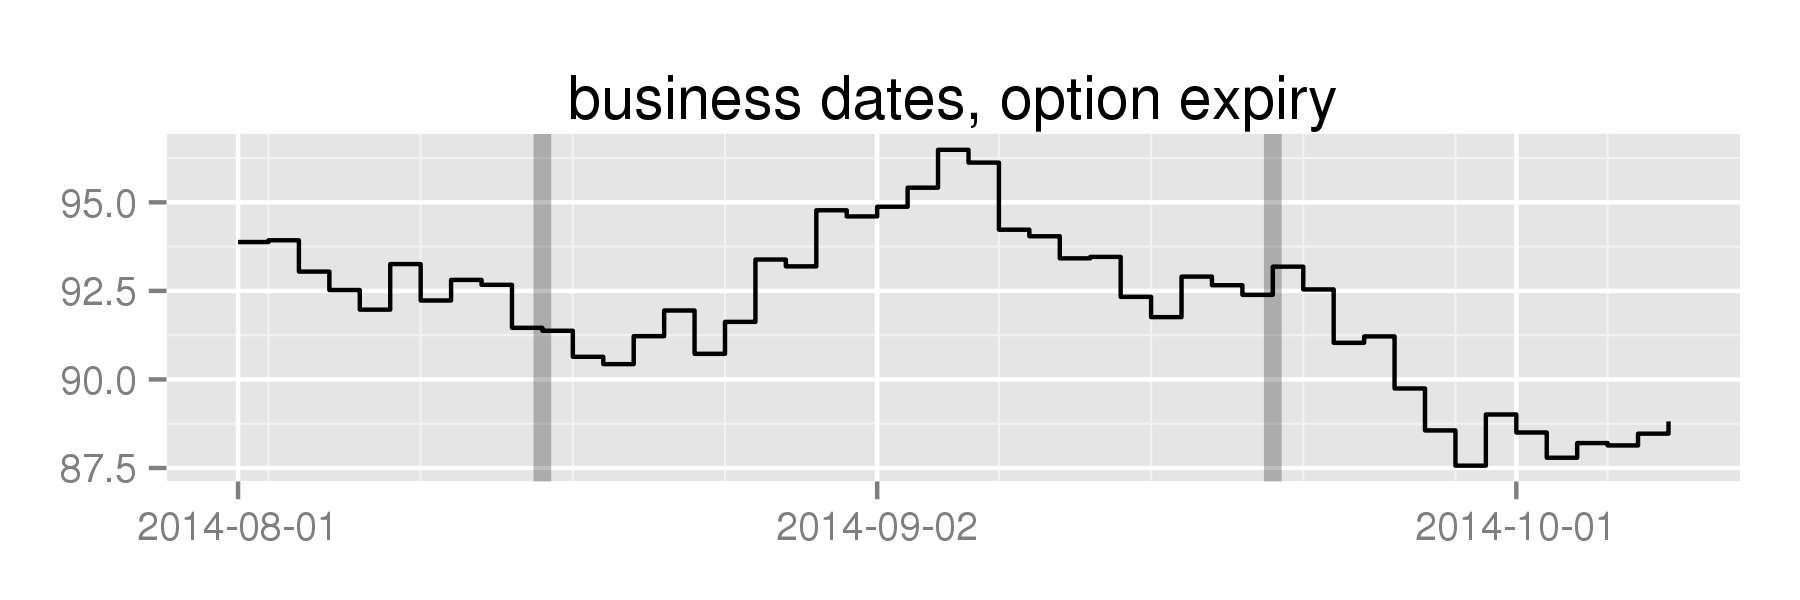
These binaries (installable software) and packages are in development.
They may not be fully stable and should be used with caution. We make no claims about them.