The hardware and bandwidth for this mirror is donated by METANET, the Webhosting and Full Service-Cloud Provider.
If you wish to report a bug, or if you are interested in having us mirror your free-software or open-source project, please feel free to contact us at mirror[@]metanet.ch.

O pacote beautils (Bioestatística e Experimentação Agrícola Utils) fornece funções utilitárias e conjuntos de dados para fins de ensino na disciplina de Bioestatística e Experimentação Agrícola do curso de Agronomia da UFSC.
Você pode instalar a versão de desenvolvimento do beautils do GitHub com:
# install.packages("pak")
pak::pak("nepem-ufsc/beautils")library(beautils)
#>
#> Anexando pacote: 'beautils'
#> O seguinte objeto é mascarado por 'package:stats':
#>
#> filter
library(ggplot2)
#> Warning: pacote 'ggplot2' foi compilado no R versão 4.5.2
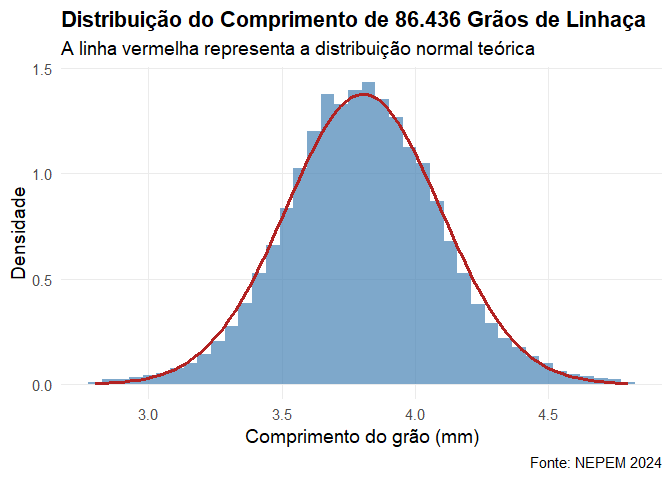
df <- df_normal()
library(ggplot2)
# Calculando a média e desvio padrão antes para deixar o código do plot limpo
media_comp <- mean(df$length, na.rm = TRUE)
sd_comp <- sd(df$length, na.rm = TRUE)
ggplot(df, aes(x = length)) +
# Histograma com cores mais profissionais
geom_histogram(aes(y = after_stat(density)),
bins = 40,
fill = "steelblue",
alpha = 0.7) +
# Curva Normal Teórica
stat_function(fun = dnorm,
args = list(mean = media_comp, sd = sd_comp),
color = "firebrick",
linewidth = 1.2) +
# Títulos e legendas em português
labs(
x = "Comprimento do grão (mm)",
y = "Densidade",
title = "Distribuição do Comprimento de 86.436 Grãos de Linhaça",
subtitle = "A linha vermelha representa a distribuição normal teórica",
caption = "Fonte: NEPEM 2024"
) +
# Tema limpo e ajustes de texto
theme_minimal(base_size = 14) +
theme(
plot.title = element_text(face = "bold"),
panel.grid.minor = element_blank()
)
df_eucalipto() |>
  group_by(fila) |>
  desc_stat(circunferencia)
#> # A tibble: 5 × 11
#> # Groups:   fila [5]
#>   fila  variable          cv   max  mean median   min sd.amo    se  ci.t n.valid
#>   <chr> <chr>          <dbl> <dbl> <dbl>  <dbl> <dbl>  <dbl> <dbl> <dbl>   <dbl>
#> 1 F1    circunferencia  16.7  53.3  38.5   38.2  31.5   6.44  1.72  3.72      14
#> 2 F2    circunferencia  14.0  46.5  38.7   39.4  25.2   5.44  1.45  3.14      14
#> 3 F3    circunferencia  17.0  49.2  37.5   36.8  25.3   6.37  1.70  3.68      14
#> 4 F4    circunferencia  17.8  44.1  33.9   33.6  24.5   6.04  1.62  3.49      14
#> 5 F5    circunferencia  31.9  39.5  24.9   21.6  15.4   7.96  2.13  4.60      14
These binaries (installable software) and packages are in development.
They may not be fully stable and should be used with caution. We make no claims about them.