The hardware and bandwidth for this mirror is donated by METANET, the Webhosting and Full Service-Cloud Provider.
If you wish to report a bug, or if you are interested in having us mirror your free-software or open-source project, please feel free to contact us at mirror[@]metanet.ch.
![]()
![]()
The goal of consort is to make it easy to create CONSORT
diagrams for the transparent reporting of participant allocation in
randomized, controlled clinical trials. This is done by creating a
standardized disposition data, and using this data as the source for the
creation a standard CONSORT diagram. Human effort by supplying text
labels on the node can also be achieved.
You can install the released version of consort from CRAN with:
install.packages("consort")And the development version from GitHub with:
# install.packages("devtools")
devtools::install_github("adayim/consort")This is a basic example which shows you how to solve a create CONSORT diagram with a given subject disposition data:
library(consort)
library(grid)
## basic example codeset.seed(1001)
N <- 300
trialno <- sample(c(1000:2000), N)
exc <- rep(NA, N)
exc[sample(1:N, 15)] <- sample(c("Sample not collected", "MRI not collected", "Other"),
15, replace = T, prob = c(0.4, 0.4, 0.2))
arm <- rep(NA, N)
arm[is.na(exc)] <- sample(c("Conc", "Seq"), sum(is.na(exc)), replace = T)
fow1 <- rep(NA, N)
fow1[!is.na(arm)] <- sample(c("Withdraw", "Discontinued", "Death", "Other", NA),
sum(!is.na(arm)), replace = T,
prob = c(0.05, 0.05, 0.05, 0.05, 0.8))
fow2 <- rep(NA, N)
fow2[!is.na(arm) & is.na(fow1)] <- sample(c("Protocol deviation", "Outcome missing", NA),
sum(!is.na(arm) & is.na(fow1)), replace = T,
prob = c(0.05, 0.05, 0.9))
df <- data.frame(trialno, exc, arm, fow1, fow2)
head(df)
#> trialno exc arm fow1 fow2
#> 1 1086 <NA> Conc <NA> <NA>
#> 2 1418 <NA> Seq <NA> <NA>
#> 3 1502 <NA> Conc Death <NA>
#> 4 1846 <NA> Conc <NA> <NA>
#> 5 1303 <NA> Conc Death <NA>
#> 6 1838 <NA> Seq <NA> <NA>
set_consort_defaults(txt_gp = gpar(cex = 0.6), parse_markup = TRUE)

out <- consort_plot(data = df,
             order = c(trialno = "Population",
                          exc    = "**Excluded**",
                          arm     = "Randomized patient",
                          fow1    = "Lost of Follow-up",
                          trialno = "Finished Followup",
                          fow2    = "Not evaluable",
                          trialno = "Final Analysis"),
             side_box = c("exc", "fow1", "fow2"),
             allocation = "arm",
             labels = c("1" = "Screening", "2" = "Randomization",
                        "5" = "Final"))

plot(out)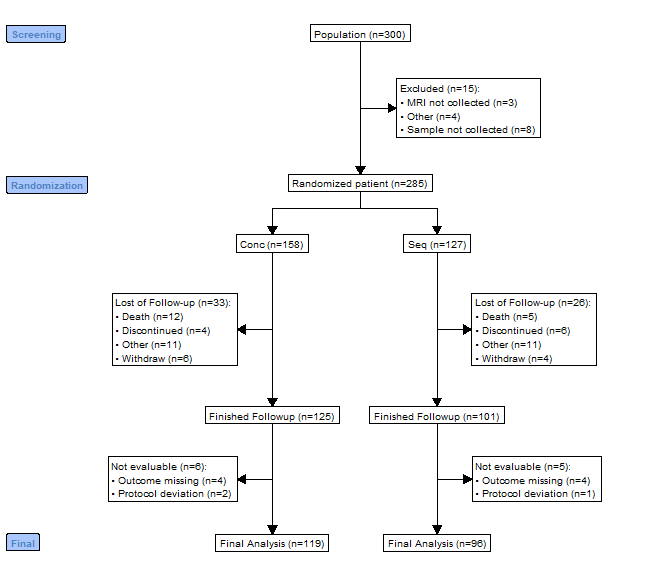
As the grid plotting is not very ideal, calculation of
the coodinates for the nodes are not easy job and tried my best. Feel
free to PR if you want to improve. Or you can produce
Graphviz plot by setting grViz = TRUE in
plot. This will use DiagrammeR to print the
plot. The plot is ideal for Shiny or HTML output.
plot(out, grViz = TRUE)Or save this Graphviz plot to png or
pdf
plot(g, grViz = TRUE) |>
    DiagrammeRsvg::export_svg() |>
    charToRaw() |>
    rsvg::rsvg_pdf("svg_graph.pdf")
These binaries (installable software) and packages are in development.
They may not be fully stable and should be used with caution. We make no claims about them.