The hardware and bandwidth for this mirror is donated by METANET, the Webhosting and Full Service-Cloud Provider.
If you wish to report a bug, or if you are interested in having us mirror your free-software or open-source project, please feel free to contact us at mirror[@]metanet.ch.
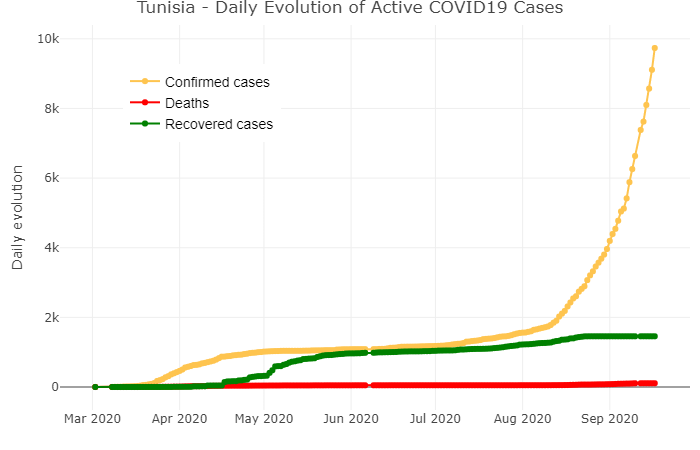
This package provides per-day data on COVID-19 cases in Tunisia.
The data is an average over all of the sources provided by Mouna Belaid. Please check out this link.
Using the programming language R, you can install the released version of covid19tunisia with :
remotes::install_github("MounaBelaid/covid19tunisia")data <- refresh_covid19tunisia()
head(data)
#> # A tibble: 6 x 7
date location location_type location_code location_code_type data_type value
<date> <chr> <chr> <chr> <chr> <chr> <dbl>
1 2020-03-02 Gafsa state TN-71 iso_3166_2 cases_new 1
2 2020-03-08 Mahdia state TN-53 iso_3166_2 cases_new 1
3 2020-03-09 Bizerte state TN-23 iso_3166_2 cases_new 1
4 2020-03-09 Mahdia state TN-53 iso_3166_2 cases_new 1
5 2020-03-09 Tunis state TN-11 iso_3166_2 cases_new 1
6 2020-03-10 Mahdia state TN-53 iso_3166_2 cases_new 1# Transform the data
library(dplyr)
library(tidyr)
library(plotly)
data_transformed <- data %>% group_by(date, data_type) %>% summarise(value = sum(value)) %>%
spread(data_type, value)
head(data_transformed)
# A tibble: 6 x 4
# Groups: date [6]
date cases_new deaths_new recovered_new
<date> <dbl> <dbl> <dbl>
1 2020-03-02 1 0 0
2 2020-03-08 1 0 0
3 2020-03-09 3 0 0
4 2020-03-10 1 0 0
5 2020-03-11 1 0 0
6 2020-03-12 6 0 0
data_transformed %>%
ungroup() %>% plot_ly(type = 'scatter',
mode = 'lines + markers')%>%
add_trace(x = ~date, y = ~cumsum(cases_new),
name = 'Confirmed cases',
marker = list(color = '#fec44f'),
line = list(color = '#fec44f'),
hoverinfo = "text",
text = ~paste(cases_new, "New confirmed cases\n", cumsum(cases_new), 'Total number of infected cases on', date)) %>%
add_trace(x = ~date, y = ~cumsum(deaths_new),
name = 'Deaths',
marker = list(color = 'red'),
line = list(color = 'red'),
hoverinfo = "text",
text = ~paste(deaths_new, "New deaths\n", cumsum(deaths_new), 'Total number of deaths on', date)) %>%
add_trace(x = ~date, y = ~cumsum(recovered_new),
name = 'Recovered cases',
marker = list(color = 'green'),
line = list(color = 'green'),
hoverinfo = "text",
text = ~paste(recovered_new, "New recovered cases\n", cumsum(recovered_new), 'Total number of recovered cases on', date)) %>%
layout(title = 'Tunisia - Daily Evolution of Active COVID19 Cases',
legend = list(x = 0.1, y = 0.9,
font = list(family = "sans-serif", size = 14, color = "#000"), bgcolor = "",
bordercolor = "#FFFFFF", borderwidth = 2),
xaxis = list(title = ""),
yaxis = list(side = 'left', title = 'Daily evolution', showgrid = TRUE, zeroline = TRUE))
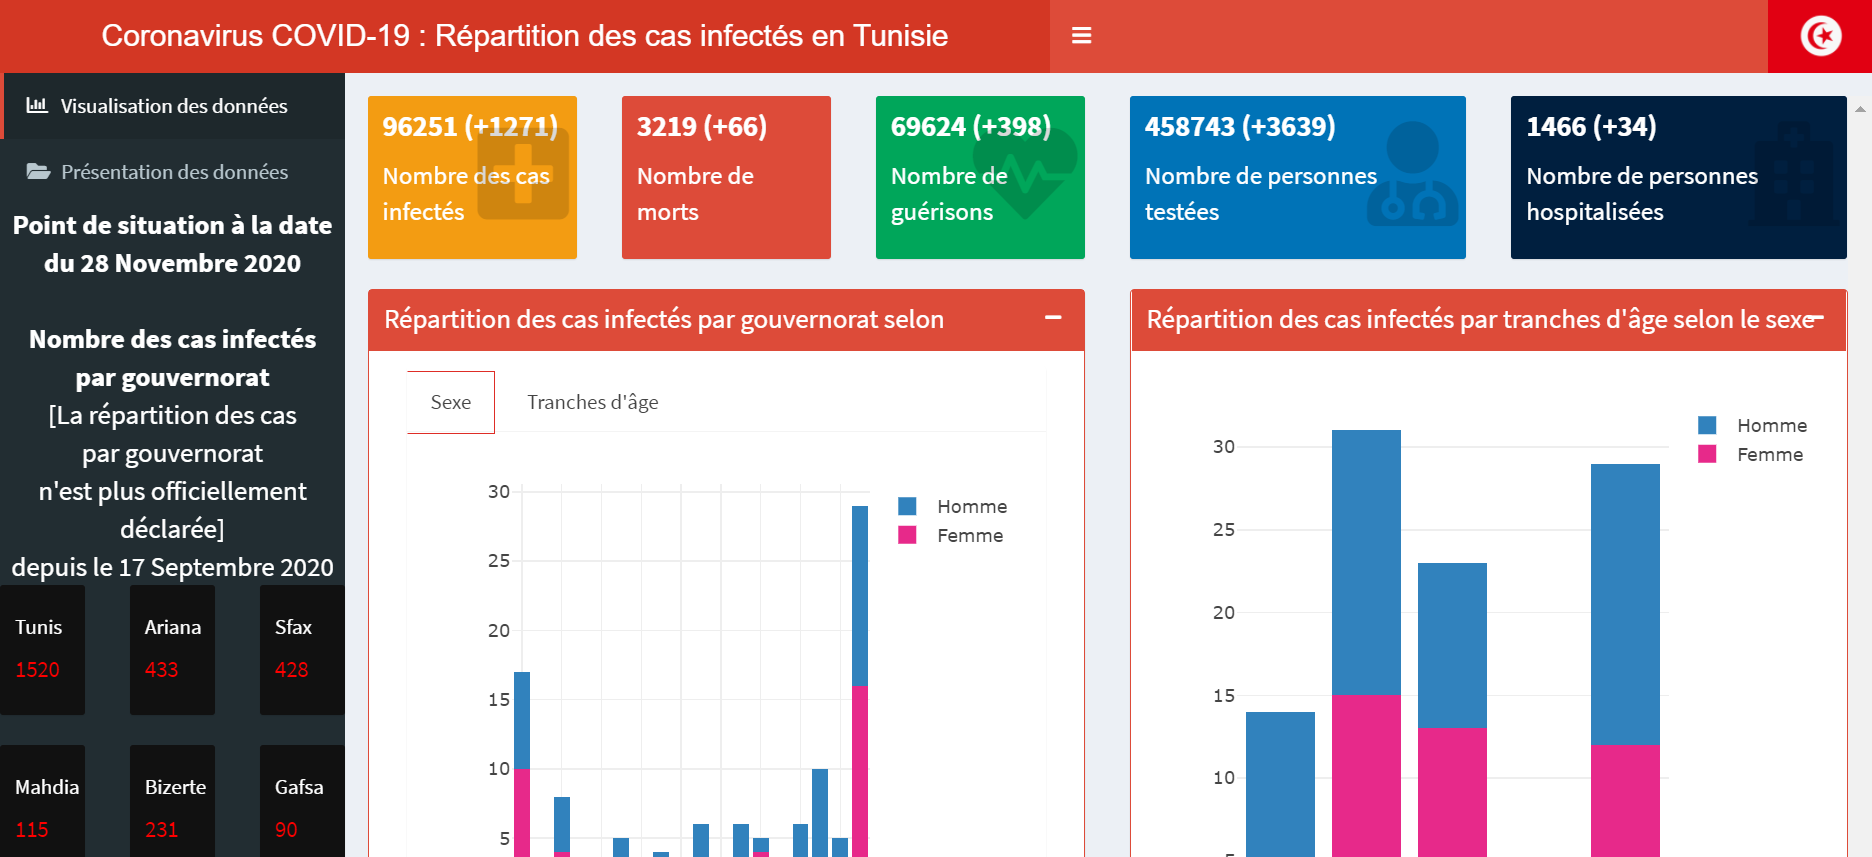
A supporting Shiny Application for the covid19tunisia dataset available here.
These binaries (installable software) and packages are in development.
They may not be fully stable and should be used with caution. We make no claims about them.