The hardware and bandwidth for this mirror is donated by METANET, the Webhosting and Full Service-Cloud Provider.
If you wish to report a bug, or if you are interested in having us mirror your free-software or open-source project, please feel free to contact us at mirror[@]metanet.ch.

This package wraps the awesome Datasaurus Dozen datasets. The
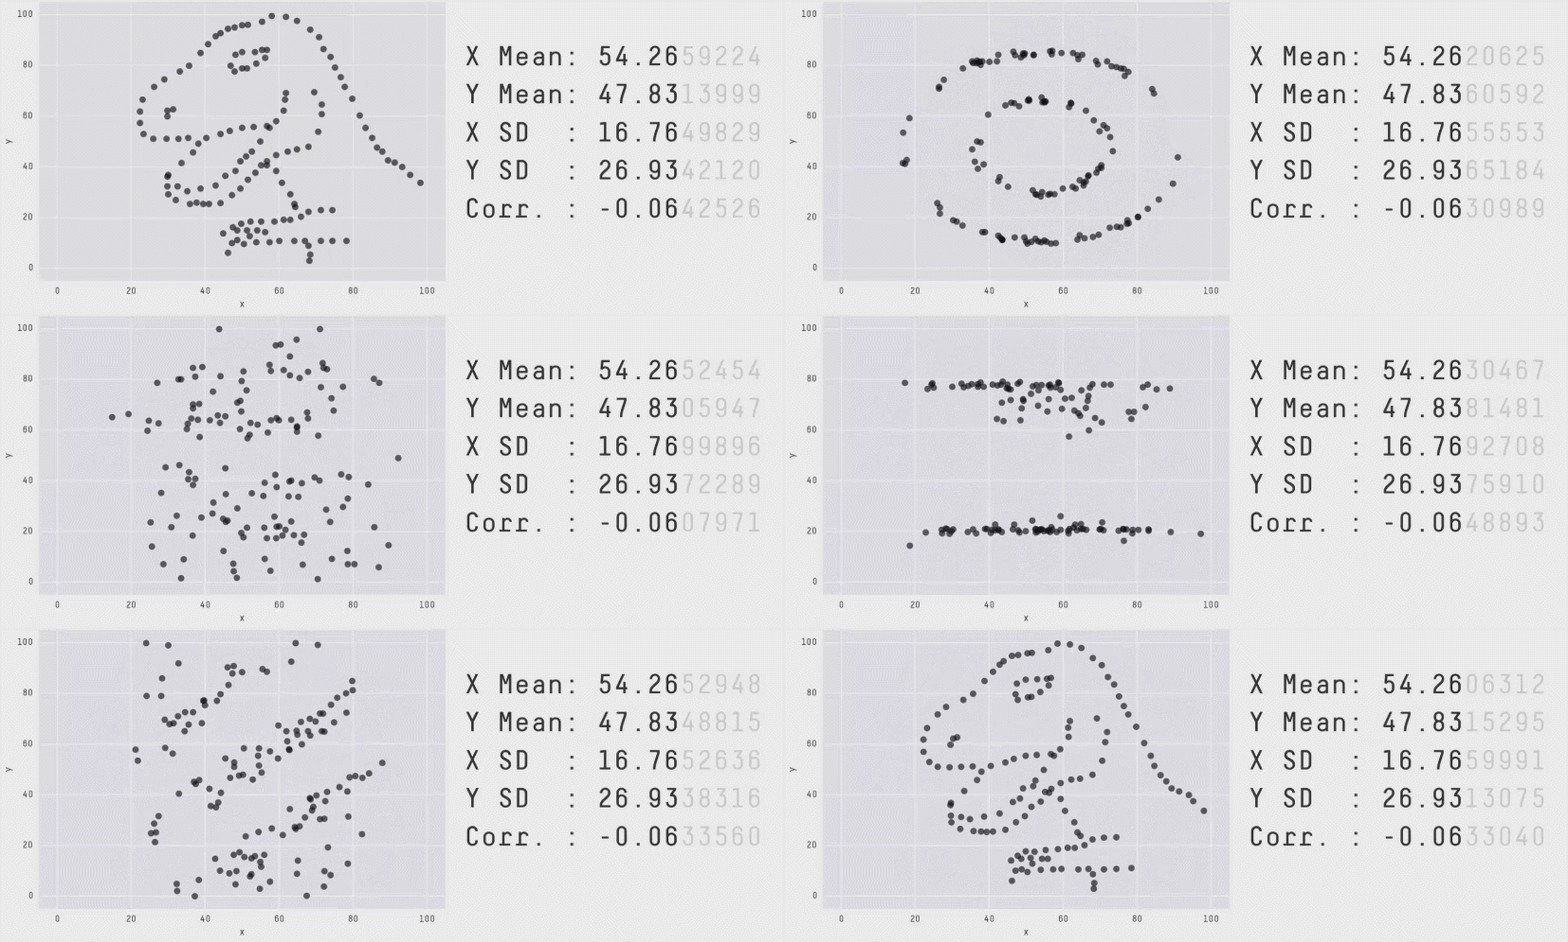
Datasaurus Dozen show us why visualisation is important – summary
statistics can be the same but distributions can be very different. In
short, this package gives a fun alternative to Anscombe’s
Quartet, available in R as anscombe.
The original Datasaurus was created by Alberto Cairo. The other Dozen were generated using simulated annealing and the process is described in the paper “Same Stats, Different Graphs: Generating Datasets with Varied Appearance and Identical Statistics through Simulated Annealing” by Justin Matejka and George Fitzmaurice (open access materials including manuscript and code, official paper).
In the paper, Justin and George simulate a variety of datasets that the same summary statistics to the Datasaurus but have very different distributions.

The latest stable version is available on CRAN
install.packages("datasauRus")You can get the latest development version from GitHub, so use {devtools} to install the package
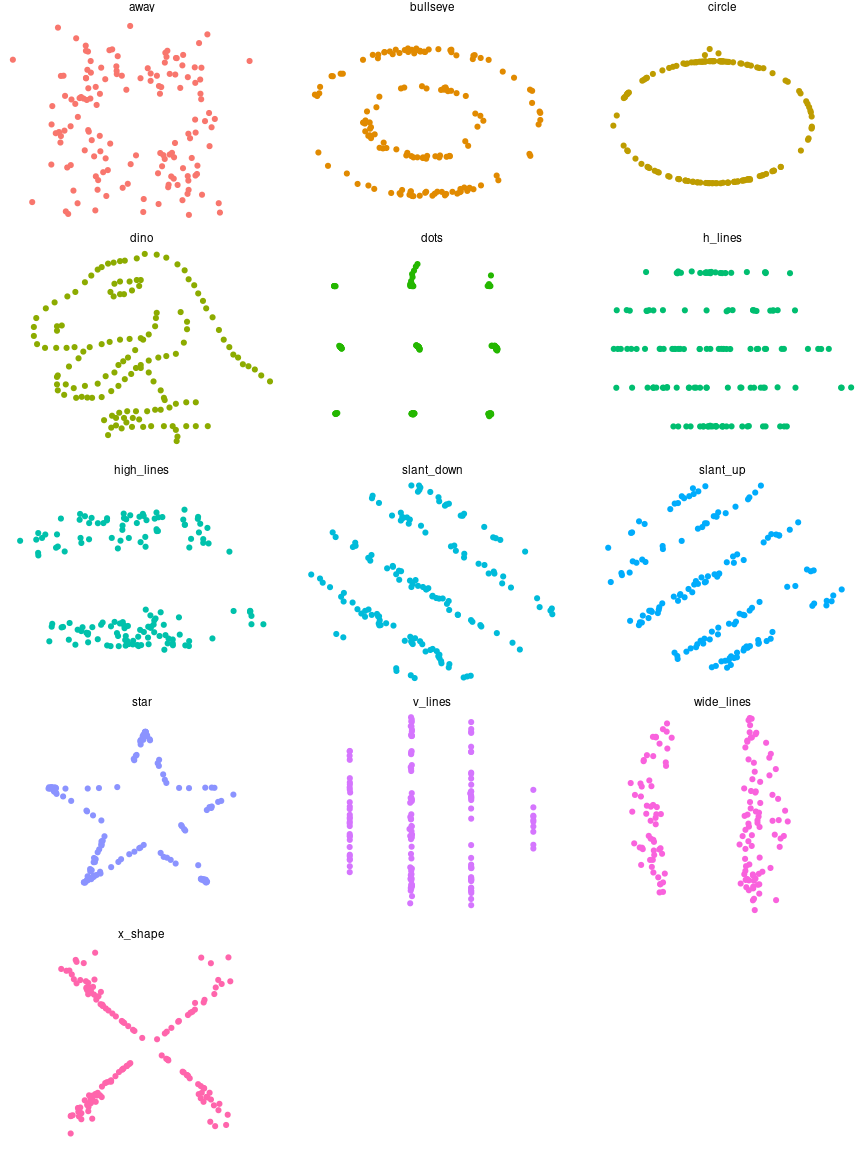
devtools::install_github("jumpingrivers/datasauRus")You can use the package to produce Anscombe plots and more.
library("ggplot2")
library("datasauRus")
ggplot(datasaurus_dozen, aes(x = x, y = y, colour = dataset))+
  geom_point() +
  theme_void() +
  theme(legend.position = "none")+
  facet_wrap(~dataset, ncol = 3)
Please note that the datasauRus project is released with a Contributor Code of Conduct. By contributing to this project, you agree to abide by its terms
These binaries (installable software) and packages are in development.
They may not be fully stable and should be used with caution. We make no claims about them.