The hardware and bandwidth for this mirror is donated by METANET, the Webhosting and Full Service-Cloud Provider.
If you wish to report a bug, or if you are interested in having us mirror your free-software or open-source project, please feel free to contact us at mirror[@]metanet.ch.
![]()
![]()
The goal of designit is to generate optimal sample allocations for experimental designs.
You can install the development version from GitHub with:
# install.packages("devtools")
devtools::install_github("BEDApub/designit")
The main class used is BatchContainer, which holds the
dimensions for sample allocation. After creating such a container, a
list of samples can be allocated in it using a given assignment
function.
library(tidyverse)
library(designit)

data("longitudinal_subject_samples")

# we use a subset of longitudinal_subject_samples data
subject_data <- longitudinal_subject_samples %>%
  filter(Group %in% 1:5, Week %in% c(1,4)) %>%
  select(SampleID, SubjectID, Group, Sex, Week) %>%
  # with two observations per patient
  group_by(SubjectID) %>%
  filter(n() == 2) %>%
  ungroup() %>%
  select(SubjectID, Group, Sex) %>%
  distinct()

head(subject_data)
#> # A tibble: 6 × 3
#>   SubjectID Group Sex
#>   <chr>     <chr> <chr>
#> 1 P01       1     F
#> 2 P02       1     M
#> 3 P03       1     M
#> 4 P04       1     F
#> 5 P19       1     M
#> 6 P20 1 FBatchContainer and assigning samples# a batch container with 3 batches and 11 locations per batch
bc <- BatchContainer$new(
dimensions = list("batch" = 3, "location" = 11),
)
# assign samples randomly
set.seed(17)
bc <- assign_random(bc, subject_data)
bc$get_samples() %>%
ggplot() +
aes(x = batch, fill = Group) +
geom_bar()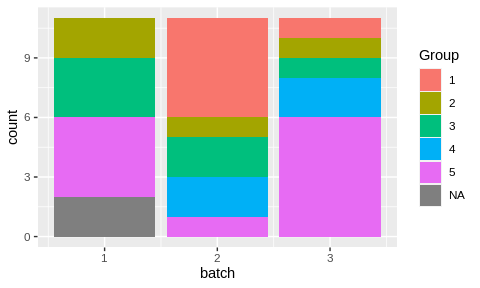
Random assignmet of samples to batches produced an uneven distribution.
# set scoring functions
scoring_f <- list(
  # first priority, groups are evenly distributed
  group = osat_score_generator(batch_vars = "batch",
                               feature_vars = "Group"),
  # second priority, sexes are evenly distributed
  sex = osat_score_generator(batch_vars = "batch",
                             feature_vars = "Sex")
)

bc <- optimize_design(
  bc, scoring = scoring_f, max_iter = 150, quiet = TRUE
)

bc$get_samples() %>%
  ggplot() +
  aes(x = batch, fill = Group) +
  geom_bar()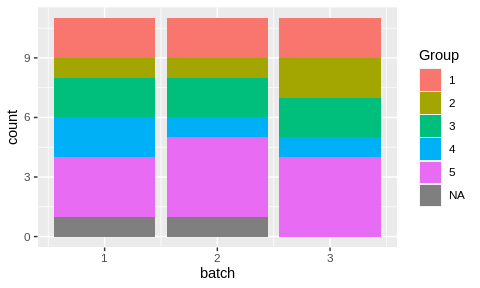
# show optimization trace
bc$plot_trace()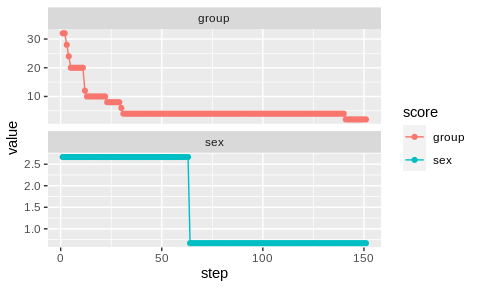
See vignettes vignette("basic_examples").
The logo is inspired by DALL-E 2 and pipette icon by gsagri04.
These binaries (installable software) and packages are in development.
They may not be fully stable and should be used with caution. We make no claims about them.