The hardware and bandwidth for this mirror is donated by METANET, the Webhosting and Full Service-Cloud Provider.
If you wish to report a bug, or if you are interested in having us mirror your free-software or open-source project, please feel free to contact us at mirror[@]metanet.ch.
![]()
![]()
![]()
The goal of dockViewR is to provide a layout manager for Shiny apps and interactive R documents. It builds on top of dockview.
The latest version of the dockViewR package can be obtained from CRAN:
# install.packages("pak")
pak::pak("dockViewR")
Or, you can install the development version of dockViewR like so:
pak::pak("cynkra/dockViewR")This is a basic example which shows you how spin up a simple dockview app:
library(shiny)
library(bslib)
library(visNetwork)
library(dockViewR)

nodes <- data.frame(id = 1:3)
edges <- data.frame(from = c(1, 2), to = c(1, 3))

ui <- page_fillable(
  dockViewOutput("dock")
)

server <- function(input, output, session) {
  exportTestValues(
    panel_ids = get_panels_ids("dock"),
    active_group = get_active_group("dock"),
    grid = get_grid("dock")
  )

  output$dock <- renderDockView({
    dock_view(
      panels = list(
        panel(
          id = "1",
          title = "Panel 1",
          content = tagList(
            sliderInput(
              "obs",
              "Number of observations:",
              min = 0,
              max = 1000,
              value = 500
            ),
            plotOutput("distPlot")
          )
        ),
        panel(
          id = "2",
          title = "Panel 2",
          content = tagList(
            visNetworkOutput("network")
          ),
          position = list(
            referencePanel = "1",
            direction = "right"
          ),
          minimumWidth = 500
        ),
        panel(
          id = "3",
          title = "Panel 3",
          content = tagList(
            selectInput(
              "variable",
              "Variable:",
              c("Cylinders" = "cyl", "Transmission" = "am", "Gears" = "gear")
            ),
            tableOutput("data")
          ),
          position = list(
            referencePanel = "2",
            direction = "below"
          )
        )
      ),
      theme = "replit"
    )
  })

  output$distPlot <- renderPlot({
    req(input$obs)
    hist(rnorm(input$obs))
  })

  output$network <- renderVisNetwork({
    visNetwork(nodes, edges, width = "100%")
  })

  output$data <- renderTable(
    {
      mtcars[, c("mpg", input$variable), drop = FALSE]
    },
    rownames = TRUE
  )
}

shinyApp(ui, server)We welcome contributions! If you’d like to help improve
{dockViewR}, feel free to submit issues, feature requests,
or pull requests.
{dockViewR} is an htmlwidget, an
interactive widget for R, powered by a JS library. To get a minimum
starting kit:
To contribute to this project, you’ll need npm,
node, and the R package {packer} to compile
the JavaScript code. Please follow guide here. When
you are in the project, do the following:
pak::pak("packer")
# Restore JavaScript dependencies in package-lock.json (a bit like the renv.lock)
packer::npm_install()
The JS code uses ES6
modules, meaning that you can define a module in a
srcjs/component.js script as follows:
export const blabla = () => {
  console.log("Blabla");
}
and use it in another script, let’s say ./otherscript.js
like so:
// ./otherscript.js
import { blabla } from './components.js'
Whenever you are done with changing the JS script, you have to rebuild it:
# Change the code and then rebundle
packer::bundle("development") # For developement mode
packer::bundle() # For production. Defaut!
You may as well bundle for dev using
packer::bundle_dev() when in developer mode and when ready
for production use packer::bundle_prod(). You may also
consider watch() which watches for changes in the
srcjs and rebuilds if necessary, equivalent to
npm run watch.
{dockViewR}, like in
inst/examples/demo, open the viewer on a web browser window
(preferably Chrome as it is used to illustrate the action in this step,
as other browser devtools differ in term of layout).inspect
option on the drop-down menu.Sources tab. Open from the sidepanel
dockviewer/srcjs/widgets/dockview.js script 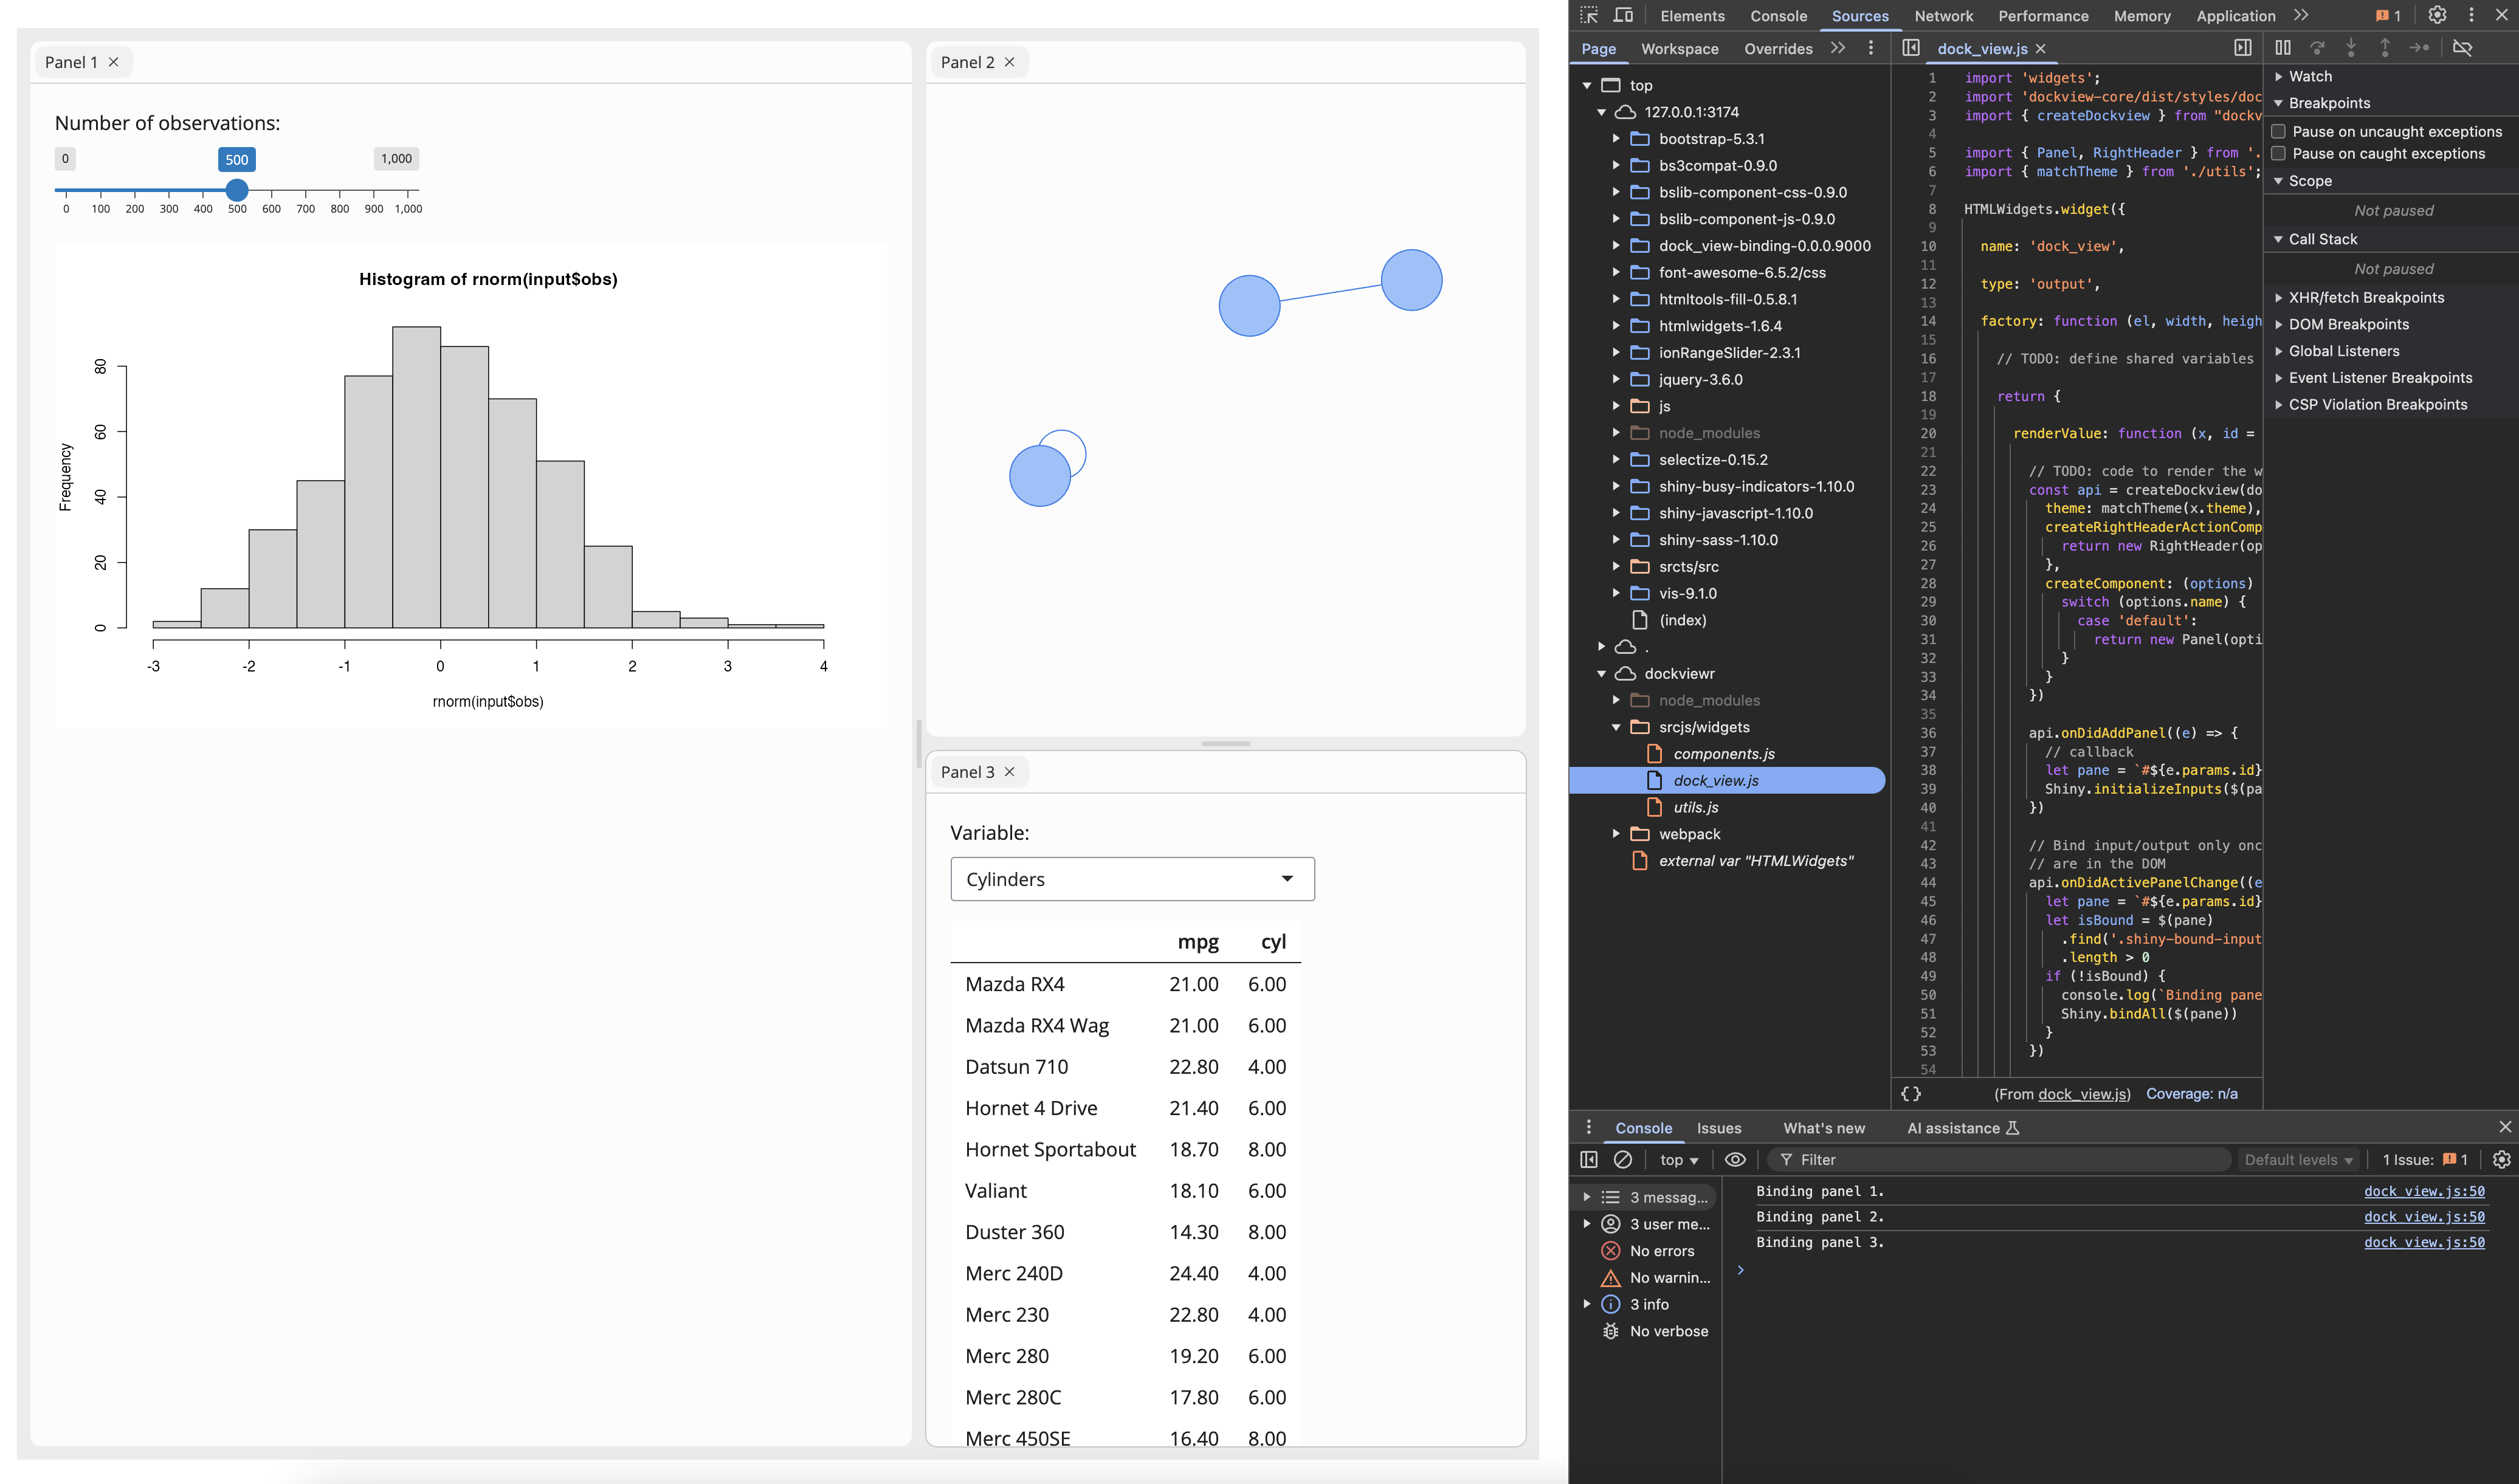 . Once the
dockview.js script is opened on the main panel. You can set
a breakpoint on any line number of the script and reload the page.This package is built on top of the amazing dockview JavaScript library.
These binaries (installable software) and packages are in development.
They may not be fully stable and should be used with caution. We make no claims about them.