The hardware and bandwidth for this mirror is donated by METANET, the Webhosting and Full Service-Cloud Provider.
If you wish to report a bug, or if you are interested in having us mirror your free-software or open-source project, please feel free to contact us at mirror[@]metanet.ch.

{epiparameter} is an R package that
contains a library of epidemiological parameters for infectious diseases
as well as classes and helper functions to work with the data. It also
includes functions to extract and convert parameters from reported
summary statistics.
{epiparameter} is developed at the Centre
for the Mathematical Modelling of Infectious Diseases at the London School of Hygiene and Tropical
Medicine as part of Epiverse-TRACE.
The package can be installed from CRAN using
install.packages("epiparameter")The development version of {epiparameter} can be
installed from GitHub using
the {pak} package:
# check whether {pak} is installed
if(!require("pak")) install.packages("pak")
pak::pak("epiverse-trace/epiparameter")
Alternatively, install pre-compiled binaries from the Epiverse TRACE R-universe
install.packages("epiparameter", repos = c("https://epiverse-trace.r-universe.dev", "https://cloud.r-project.org"))library(epiparameter)To load the library of epidemiological parameters into
R:
epiparameters <- epiparameter_db()
#> Returning 125 results that match the criteria (100 are parameterised).
#> Use subset to filter by entry variables or single_epiparameter to return a single entry.
#> To retrieve the citation for each use the 'get_citation' function
epiparameters
#> # List of 125 <epiparameter> objects
#> Number of diseases: 23
#> ❯ Adenovirus ❯ Chikungunya ❯ COVID-19 ❯ Dengue ❯ Ebola Virus Disease ❯ Hantavirus Pulmonary Syndrome ❯ Human Coronavirus ❯ Influenza ❯ Japanese Encephalitis ❯ Marburg Virus Disease ❯ Measles ❯ MERS ❯ Mpox ❯ Parainfluenza ❯ Pneumonic Plague ❯ Rhinovirus ❯ Rift Valley Fever ❯ RSV ❯ SARS ❯ Smallpox ❯ West Nile Fever ❯ Yellow Fever ❯ Zika Virus Disease
#> Number of epi parameters: 13
#> ❯ case fatality risk ❯ generation time ❯ hospitalisation to death ❯ hospitalisation to discharge ❯ incubation period ❯ notification to death ❯ notification to discharge ❯ offspring distribution ❯ onset to death ❯ onset to discharge ❯ onset to hospitalisation ❯ onset to ventilation ❯ serial interval
#> [[1]]
#> Disease: Adenovirus
#> Pathogen: Adenovirus
#> Epi Parameter: incubation period
#> Study: Lessler J, Reich N, Brookmeyer R, Perl T, Nelson K, Cummings D (2009).
#> "Incubation periods of acute respiratory viral infections: a systematic
#> review." _The Lancet Infectious Diseases_.
#> doi:10.1016/S1473-3099(09)70069-6
#> <https://doi.org/10.1016/S1473-3099%2809%2970069-6>.
#> Distribution: lnorm (days)
#> Parameters:
#>   meanlog: 1.723
#>   sdlog: 0.231
#>
#> [[2]]
#> Disease: Human Coronavirus
#> Pathogen: Human_Cov
#> Epi Parameter: incubation period
#> Study: Lessler J, Reich N, Brookmeyer R, Perl T, Nelson K, Cummings D (2009).
#> "Incubation periods of acute respiratory viral infections: a systematic
#> review." _The Lancet Infectious Diseases_.
#> doi:10.1016/S1473-3099(09)70069-7
#> <https://doi.org/10.1016/S1473-3099%2809%2970069-7>.
#> Distribution: lnorm (days)
#> Parameters:
#>   meanlog: 1.163
#>   sdlog: 0.140
#>
#> [[3]]
#> Disease: SARS
#> Pathogen: SARS-Cov-1
#> Epi Parameter: incubation period
#> Study: Lessler J, Reich N, Brookmeyer R, Perl T, Nelson K, Cummings D (2009).
#> "Incubation periods of acute respiratory viral infections: a systematic
#> review." _The Lancet Infectious Diseases_.
#> doi:10.1016/S1473-3099(09)70069-8
#> <https://doi.org/10.1016/S1473-3099%2809%2970069-8>.
#> Distribution: lnorm (days)
#> Parameters:
#>   meanlog: 1.386
#>   sdlog: 0.593
#>
#> # ℹ 122 more elements
#> # ℹ Use `print(n = ...)` to see more elements.
#> # ℹ Use `parameter_tbl()` to see a summary table of the parameters.
#> # ℹ Explore database online at: https://epiverse-trace.github.io/epiparameter/articles/database.html
This results in a list of database entries. Each entry of the library
is an <epiparameter> object.
Alternatively, the library of epiparameters can be viewed as a
vignette locally
(vignette("database", package = "epiparameter")) or on the
{epiparameter}
website.
The results can be filtered by disease and epidemiological
distribution. Here we set single_epiparameter = TRUE as we
only want a single database entry returned, and by default
(single_epiparameter = FALSE) it will return all database
entries that match the disease (disease) and
epidemiological parameter (epi_name).
influenza_incubation <- epiparameter_db(
  disease = "influenza",
  epi_name = "incubation period",
  single_epiparameter = TRUE
)
#> Using Virlogeux V, Li M, Tsang T, Feng L, Fang V, Jiang H, Wu P, Zheng J, Lau
#> E, Cao Y, Qin Y, Liao Q, Yu H, Cowling B (2015). "Estimating the
#> Distribution of the Incubation Periods of Human Avian Influenza A(H7N9)
#> Virus Infections." _American Journal of Epidemiology_.
#> doi:10.1093/aje/kwv115 <https://doi.org/10.1093/aje/kwv115>..
#> To retrieve the citation use the 'get_citation' function
influenza_incubation
#> Disease: Influenza
#> Pathogen: Influenza-A-H7N9
#> Epi Parameter: incubation period
#> Study: Virlogeux V, Li M, Tsang T, Feng L, Fang V, Jiang H, Wu P, Zheng J, Lau
#> E, Cao Y, Qin Y, Liao Q, Yu H, Cowling B (2015). "Estimating the
#> Distribution of the Incubation Periods of Human Avian Influenza A(H7N9)
#> Virus Infections." _American Journal of Epidemiology_.
#> doi:10.1093/aje/kwv115 <https://doi.org/10.1093/aje/kwv115>.
#> Distribution: weibull (days)
#> Parameters:
#>   shape: 2.101
#>   scale: 3.839
To quickly view the list of epidemiological distributions returned by
epiparameter_db() in a table, the
parameter_tbl() gives a summary of the data, and offers the
ability to subset you data by disease,
pathogen and epidemiological parameter
(epi_name).
parameter_tbl(epiparameters)
#> # Parameter table:
#> # A data frame:    125 × 7
#>    disease          pathogen epi_name prob_distribution author  year sample_size
#>    <chr>            <chr>    <chr>    <chr>             <chr>  <dbl>       <dbl>
#>  1 Adenovirus       Adenovi… incubat… lnorm             Lessl…  2009          14
#>  2 Human Coronavir… Human_C… incubat… lnorm             Lessl…  2009          13
#>  3 SARS             SARS-Co… incubat… lnorm             Lessl…  2009         157
#>  4 Influenza        Influen… incubat… lnorm             Lessl…  2009         151
#>  5 Influenza        Influen… incubat… lnorm             Lessl…  2009          90
#>  6 Influenza        Influen… incubat… lnorm             Lessl…  2009          78
#>  7 Measles          Measles… incubat… lnorm             Lessl…  2009          55
#>  8 Parainfluenza    Parainf… incubat… lnorm             Lessl…  2009          11
#>  9 RSV              RSV      incubat… lnorm             Lessl…  2009          24
#> 10 Rhinovirus       Rhinovi… incubat… lnorm             Lessl…  2009          28
#> # ℹ 115 more rows
parameter_tbl(
  epiparameters,
  epi_name = "onset to hospitalisation"
)
#> # Parameter table:
#> # A data frame:    5 × 7
#>   disease  pathogen   epi_name        prob_distribution author  year sample_size
#>   <chr>    <chr>      <chr>           <chr>             <chr>  <dbl>       <dbl>
#> 1 MERS     MERS-Cov   onset to hospi… <NA>              Assir…  2013          23
#> 2 COVID-19 SARS-CoV-2 onset to hospi… gamma             Linto…  2020         155
#> 3 COVID-19 SARS-CoV-2 onset to hospi… gamma             Linto…  2020          34
#> 4 COVID-19 SARS-CoV-2 onset to hospi… lnorm             Linto…  2020         155
#> 5 COVID-19 SARS-CoV-2 onset to hospi… lnorm             Linto…  2020          34
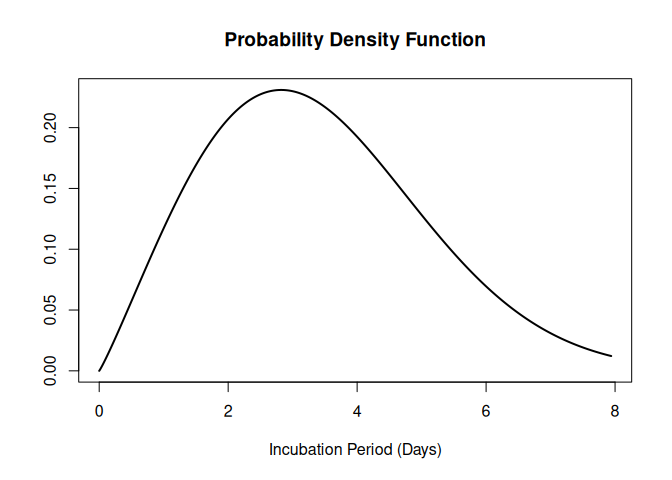
The <epiparameter> object can be plotted.
plot(influenza_incubation)
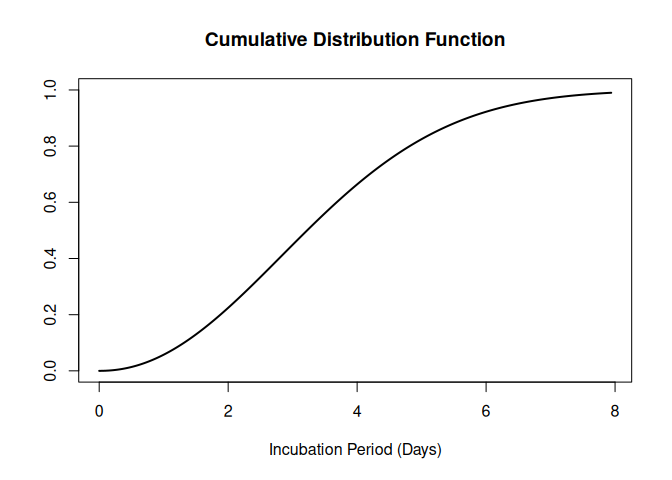
The CDF can also be plotted by setting
cumulative = TRUE.
plot(influenza_incubation, cumulative = TRUE)
The parameters of a distribution can be converted to and from mean
and standard deviation. In {epiparameter} we implement this
for a variety of distributions:
The parameters of a probability distribution can also be extracted from other summary statistics, for example, percentiles of the distribution, or the median and range of the data. This can be done for:
The library of epidemiological parameters that can be loaded by
{epiparameter} using the epiparameter_db()
function is stored in the {epiparameterDB}
R package. If you would like to contribute to the library of
epiparameters you can either:
Add data to a public google sheet. This spreadsheet contains two example entries as a guide to what fields are accepted. We are monitoring this sheet for new entries that will subsequently be included in the package.
Add to the JSON file holding the database directly via a Pull Request. See the contributing guide for instructions.
You can find a description of the epidemiological parameter data structure and contents in the data dictionary. This documents the valid format and data types to ensure consistency and accuracy. All entries in the parameter library are automatically validated against the data dictionary using an GitHub action workflow.
To report a bug please open an issue
Contributions to {epiparameter} are welcomed. package
contributing guide.
Please note that the {epiparameter} project is released
with a Contributor
Code of Conduct. By contributing to this project, you agree to abide
by its terms.
citation("epiparameter")
#> To cite package 'epiparameter' in publications use:
#>
#>   Lambert J, Kucharski A, Tamayo C (2025). _epiparameter: Classes and
#>   Helper Functions for Working with Epidemiological Parameters_.
#>   doi:10.5281/zenodo.11110881
#>   <https://doi.org/10.5281/zenodo.11110881>,
#>   <https://epiverse-trace.github.io/epiparameter/>.
#>
#> A BibTeX entry for LaTeX users is
#>
#>   @Manual{,
#>     title = {epiparameter: Classes and Helper Functions for Working with Epidemiological Parameters},
#>     author = {Joshua W. Lambert and Adam Kucharski and Carmen Tamayo},
#>     year = {2025},
#>     doi = {10.5281/zenodo.11110881},
#>     url = {https://epiverse-trace.github.io/epiparameter/},
#>   }
These binaries (installable software) and packages are in development.
They may not be fully stable and should be used with caution. We make no claims about them.