The hardware and bandwidth for this mirror is donated by METANET, the Webhosting and Full Service-Cloud Provider.
If you wish to report a bug, or if you are interested in having us mirror your free-software or open-source project, please feel free to contact us at mirror[@]metanet.ch.
Try online : https://dreamrs.shinyapps.io/esquisse/
![]()
![]()
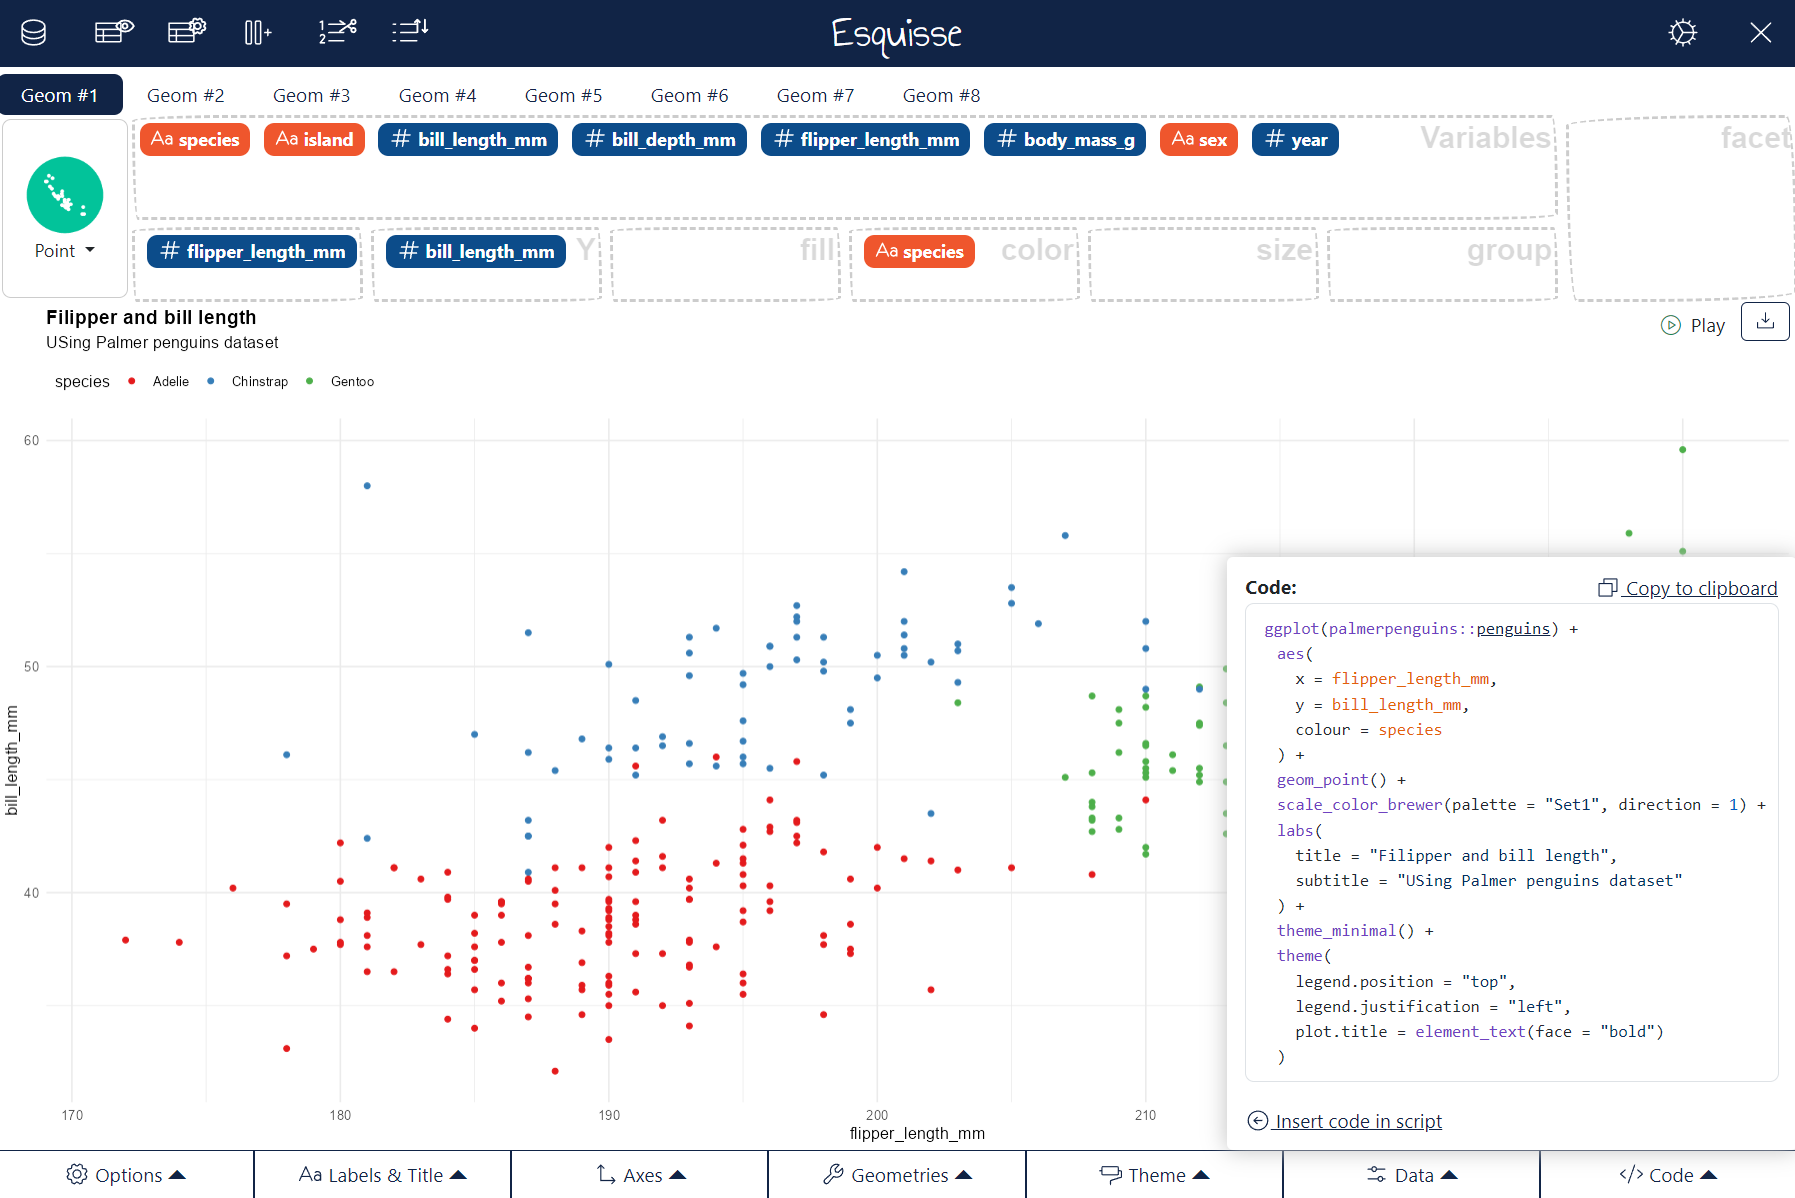
This addin allows you to interactively explore your data by visualizing it with the ggplot2 package. It allows you to draw bar plots, curves, scatter plots, histograms, boxplot and sf objects, then export the graph or retrieve the code to reproduce the graph.
See online documentation : https://dreamrs.github.io/esquisse/index.html
Use esquisse online : https://dreamrs.shinyapps.io/esquisse/
If you find bugs, please open an issue
Install from CRAN with :
install.packages("esquisse")Or install development version from GitHub :
remotes::install_github("dreamRs/esquisse")Then launch the addin via the RStudio menu or with
esquisse::esquisser().
esquisse::esquisser()
# or with your data:
esquisse::esquisser(palmerpenguins::penguins)
Above gif was made with :heart: by @mfanny and cannot be removed, but in the meantime {esquisse} has evolved, the latest version now looks like:
Currently you can use {esquisse} in the following language:
![]() english (default),
english (default),
![]() french,
french,
![]() macedonian,
macedonian,
![]()
![]() brazilian portuguese,
brazilian portuguese,
![]() albanian,
albanian,
![]() chinese,
chinese,
![]() spanish,
spanish,
![]() turkish,
turkish,
![]() korean,
korean,
![]() polish,
polish,
![]() japanese,
japanese,
![]() german.
german.
library(esquisse)
set_i18n("fr")
esquisser()
If you want another language to be supported, you can submit a Pull
Request to add a CSV file like the one used for french (file is located
in inst/i18n folder in the package, you can see it here
on GitHub).
See {datamods} vignette for more on this topic.
These binaries (installable software) and packages are in development.
They may not be fully stable and should be used with caution. We make no claims about them.