The hardware and bandwidth for this mirror is donated by METANET, the Webhosting and Full Service-Cloud Provider.
If you wish to report a bug, or if you are interested in having us mirror your free-software or open-source project, please feel free to contact us at mirror[@]metanet.ch.
![]()
![]()
{flexFitR} is an R package designed for efficient
modeling and analysis of large and complex datasets. It offers powerful
tools for parameter estimation, model fitting, and visualization,
leveraging the {optimx} package for optimization and the
{future} package for parallel processing.
Install released version from CRAN:
install.packages("flexFitR")You can also install the development version of flexFitR from GitHub with:
# install.packages("devtools")
devtools::install_github("AparicioJohan/flexFitR"){optimx} algorithms to
solve and estimate parameters for a given function.{future} package, enabling efficient fitting of hundreds of
curves simultaneously.Here’s a simple example to get you started with
{flexFitR}. This example demonstrates fitting a piecewise
regression model:
library(flexFitR)

dt <- data.frame(
  time = c(0, 29, 36, 42, 56, 76, 92, 100, 108),
  variable = c(0, 0, 0.67, 15.11, 77.38, 99.81, 99.81, 99.81, 99.81)
)
plot(explorer(dt, time, variable), type = "xy")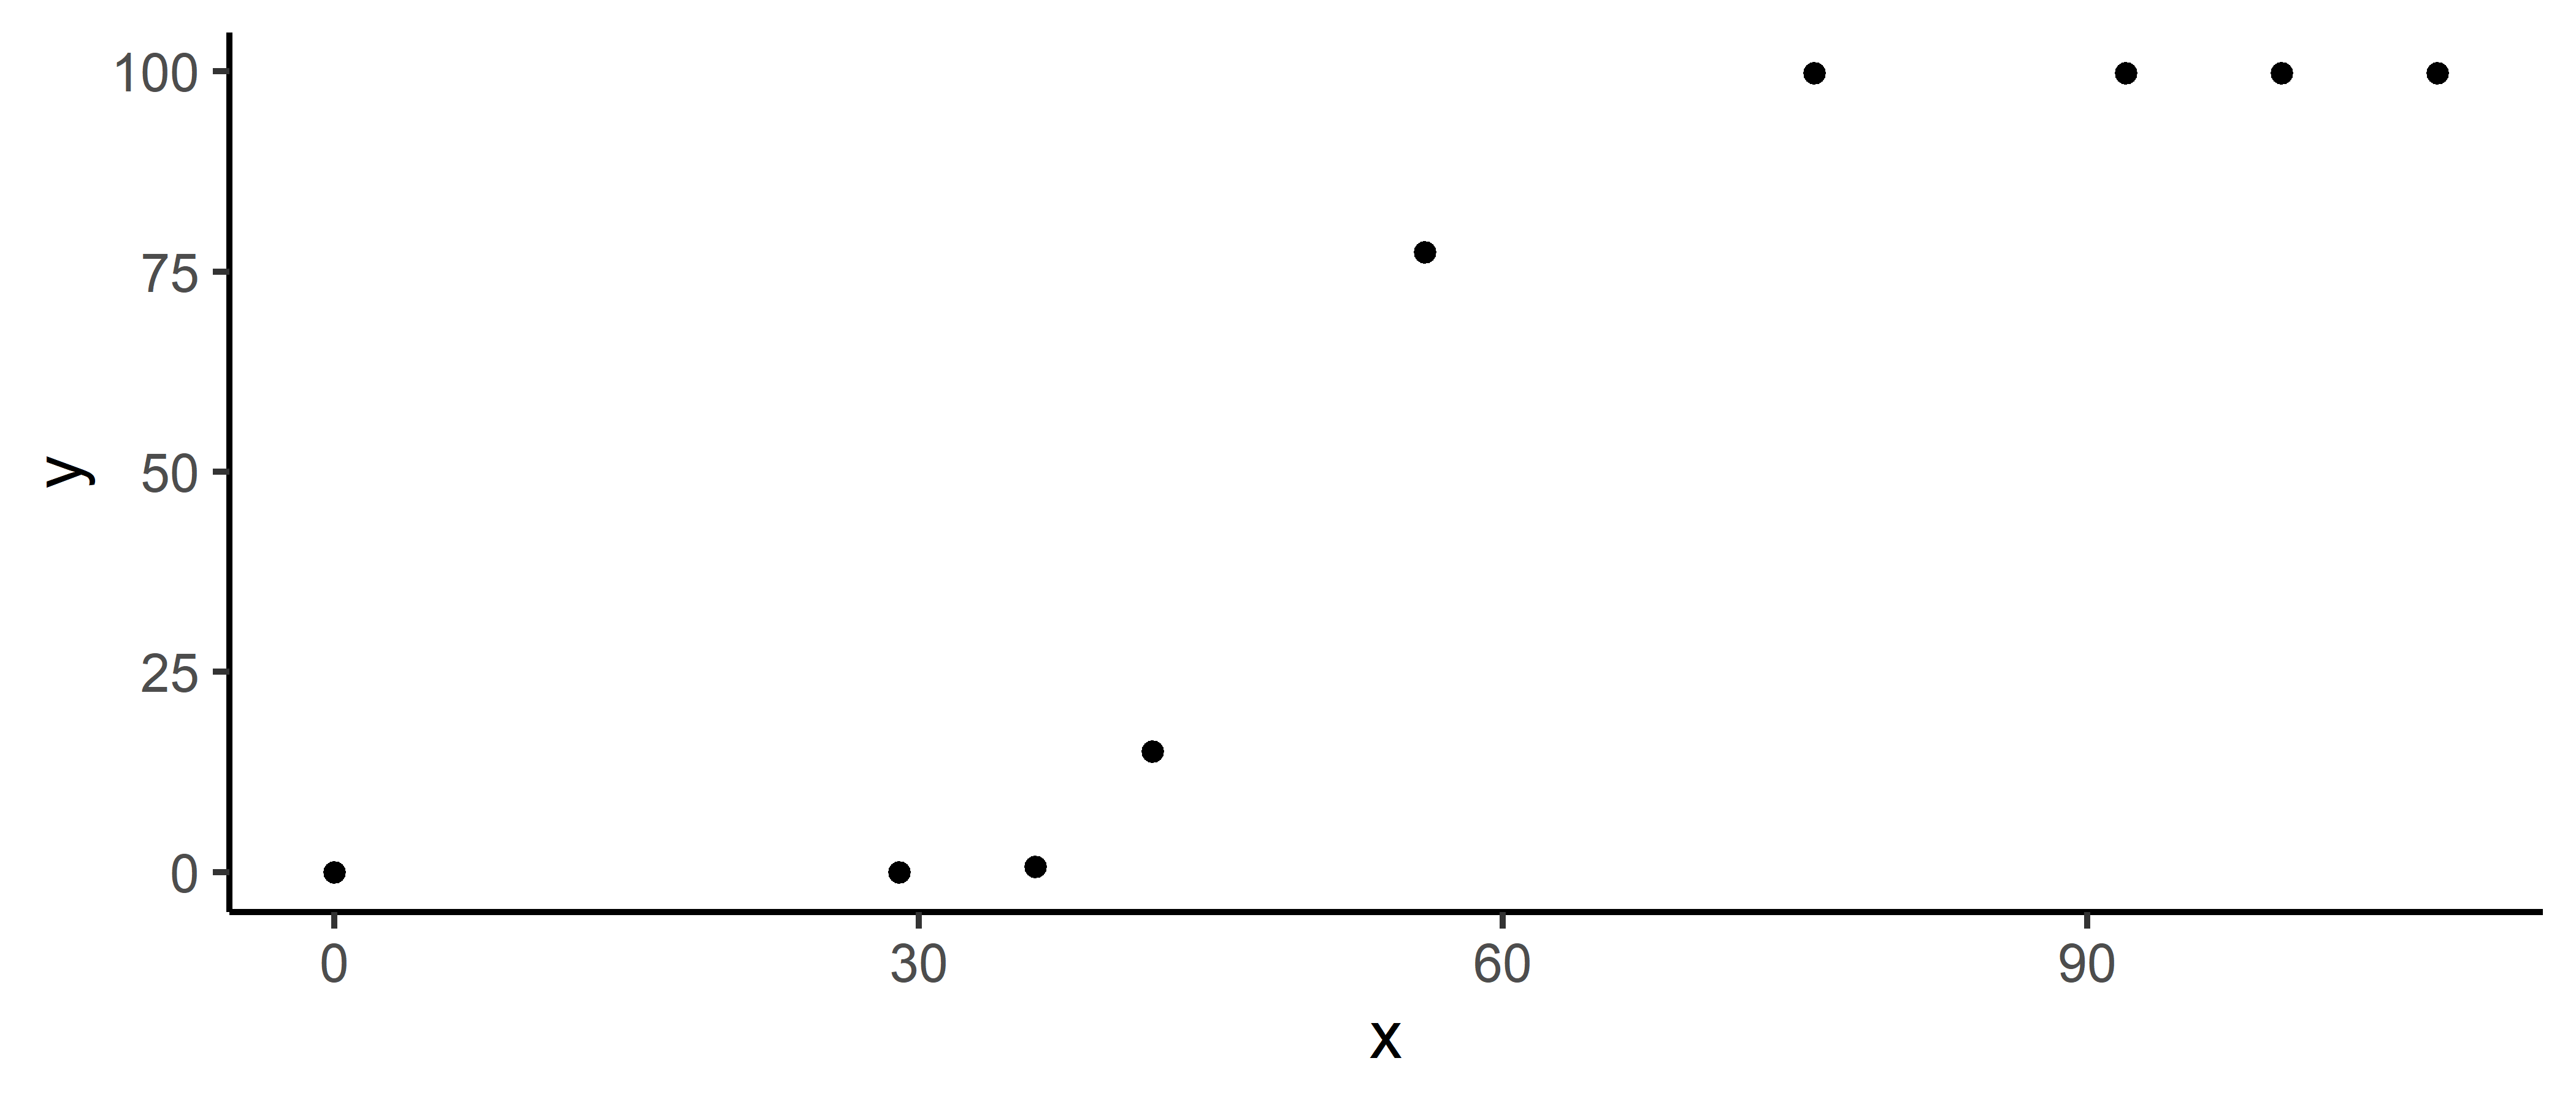
fn_lin_plat <- function(t, t1 = 45, t2 = 80, k = 0.9) {
  ifelse(
    test = t < t1,
    yes = 0,
    no = ifelse(t >= t1 & t <= t2, k / (t2 - t1) * (t - t1), k)
  )
}
# Fitting a linear plateau function
mod_1 <- dt |>
modeler(
x = time,
y = variable,
fn = "fn_lin_plat",
parameters = c(t1 = 45, t2 = 80, k = 90)
)print(mod_1)
Call:
variable ~ fn_lin_plat(time, t1, t2, k)
Residuals (`Standardized`):
Min. 1st Qu. Median Mean 3rd Qu. Max.
0.0000 0.0000 0.0000 0.2722 0.0000 2.4495
Optimization Results `head()`:
uid t1 t2 k sse
1 38.6 61 99.8 0.449
Metrics:
Groups Timing Convergence Iterations
1 0.1081 secs 100% 511 (id)# Auto plot
plot(mod_1)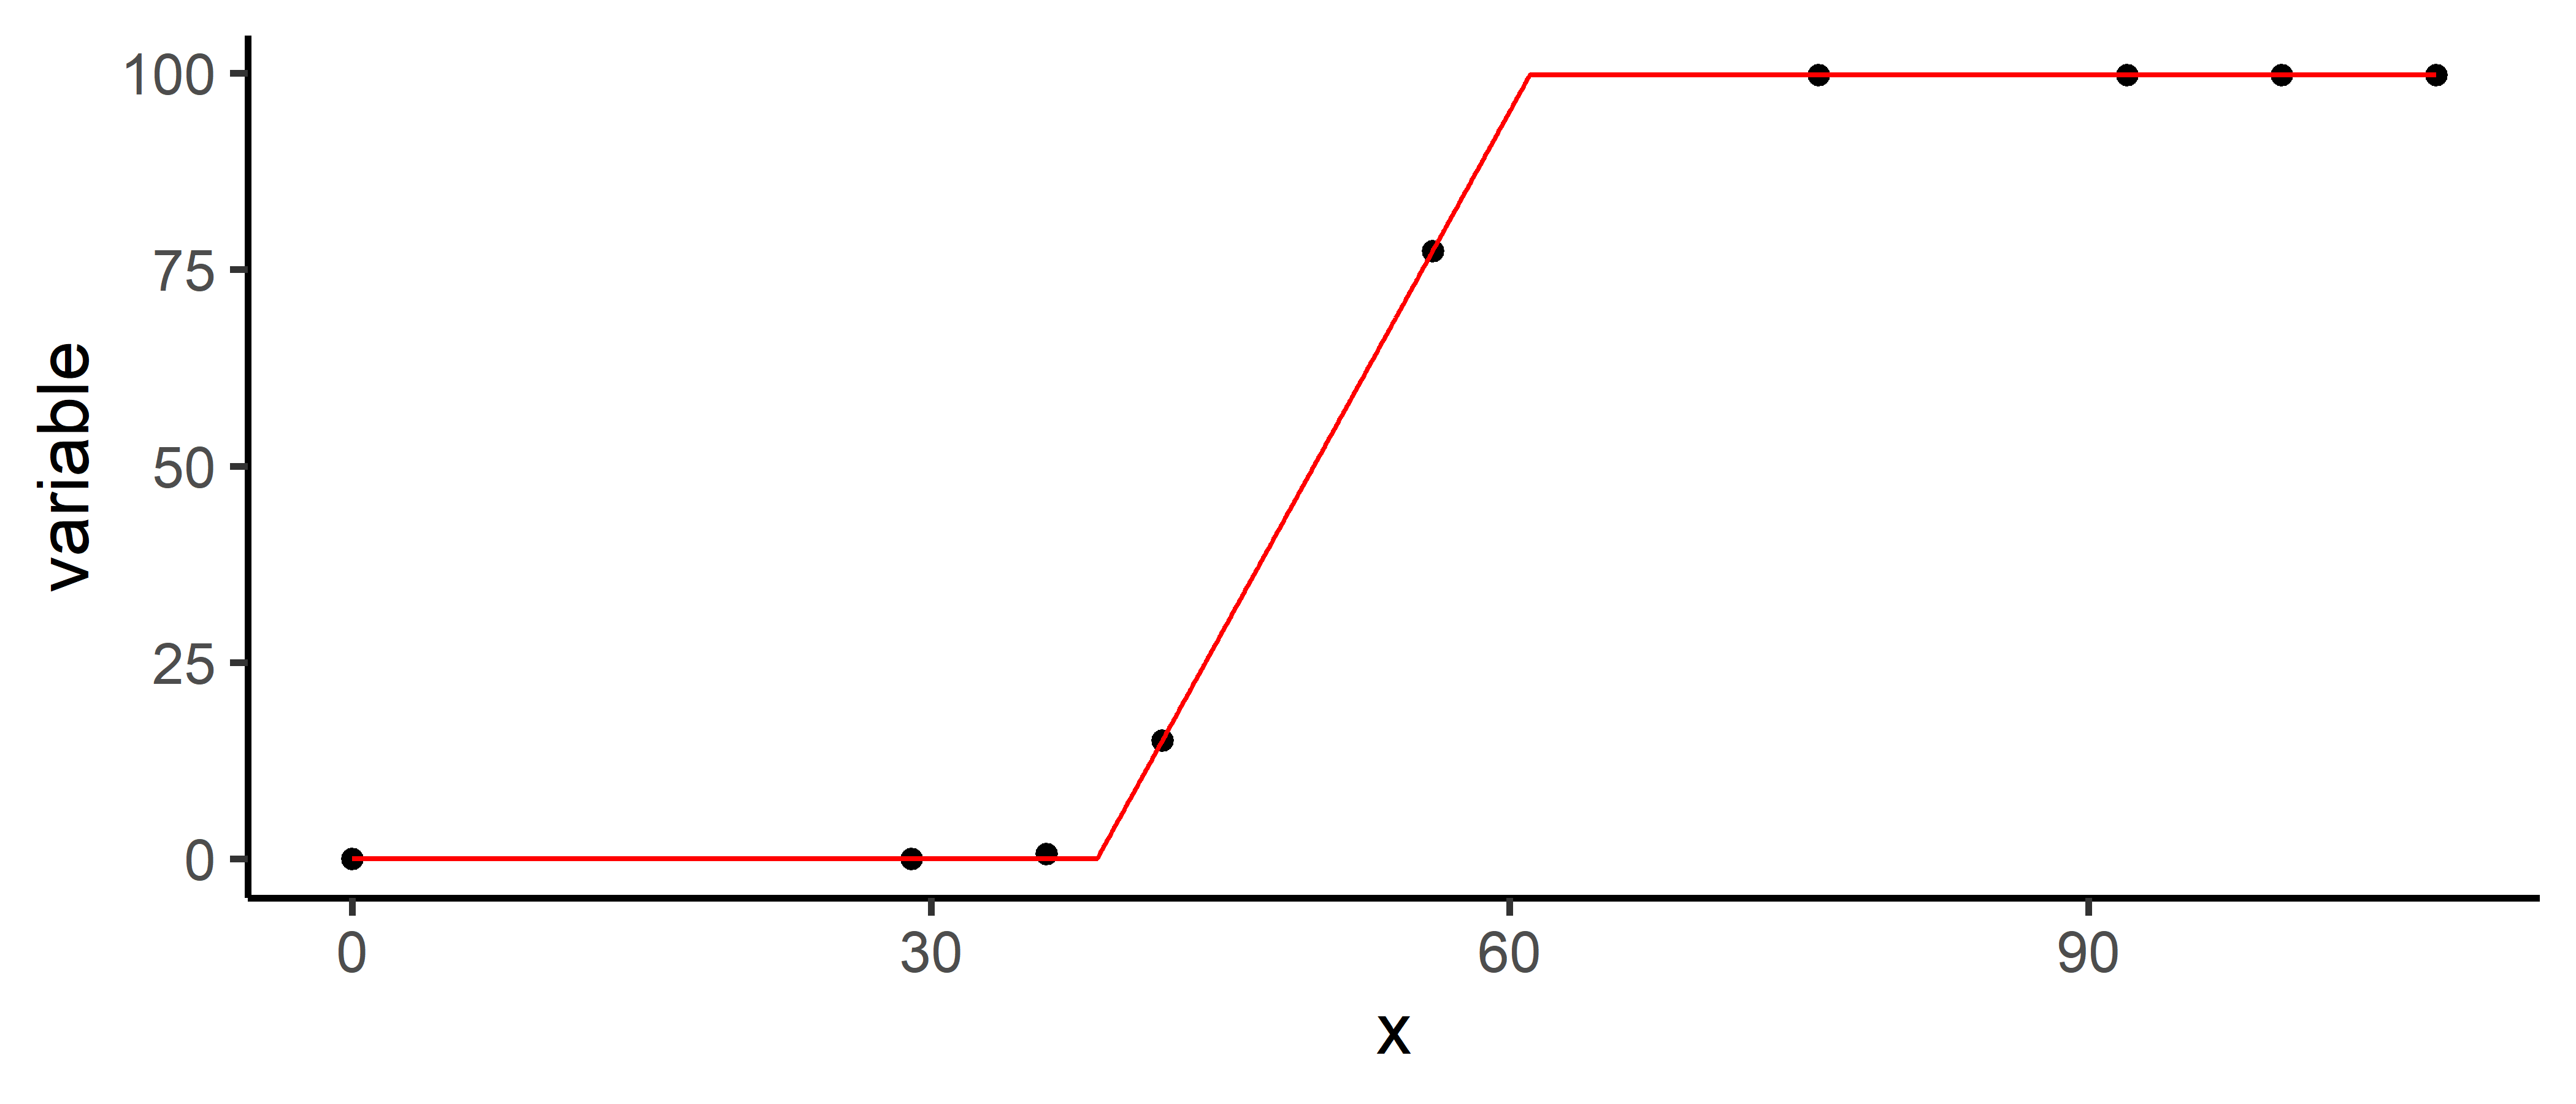
# Coefficients
coef(mod_1)
# A tibble: 3 × 7
    uid fn_name     coefficient solution std.error `t value` `Pr(>|t|)`
  <dbl> <chr>       <chr>          <dbl>     <dbl>     <dbl>      <dbl>
1     1 fn_lin_plat t1              38.6    0.0779      496.   4.54e-15
2     1 fn_lin_plat t2              61.0    0.0918      665.   7.82e-16
3     1 fn_lin_plat k               99.8    0.137       730.   4.47e-16
# Variance-Covariance Matrix
vcov(mod_1)
$`1`
t1 t2 k
t1 6.061705e-03 -0.002940001 1.877072e-07
t2 -2.940001e-03 0.008431400 4.204939e-03
k 1.877072e-07 0.004204939 1.870426e-02
attr(,"fn_name")
[1] "fn_lin_plat"# Making predictions
predict(mod_1, x = 45)
# A tibble: 1 × 5
uid fn_name x_new predicted.value std.error
<dbl> <chr> <dbl> <dbl> <dbl>
1 1 fn_lin_plat 45 28.5 0.223For detailed documentation and examples, visit flexFitR
Contributions to flexFitR are welcome! If you’d like to contribute, please fork the repository and submit a pull request. For significant changes, please open an issue first to discuss your ideas.
Please note that the flexFitR project is released with a Contributor Code of Conduct. By contributing to this project, you agree to abide by its terms.
flexFitR is licensed under the MIT License. See the LICENSE file for more details.
These binaries (installable software) and packages are in development.
They may not be fully stable and should be used with caution. We make no claims about them.