The hardware and bandwidth for this mirror is donated by METANET, the Webhosting and Full Service-Cloud Provider.
If you wish to report a bug, or if you are interested in having us mirror your free-software or open-source project, please feel free to contact us at mirror[@]metanet.ch.
Flexurba is an open-source R package to construct flexible urban delineations which can be tailored to specific applications or research questions. The package was originally developed to flexibly reconstruct the Degree of Urbanisation (DEGURBA) classification, but has since been expanded to support a broader range of delineation approaches.
The source code of the package is available on this repository and the documentation of all functions can be found on this website.
To acknowledge the use of the package and for an extensive description of its contribution, please refer to the following journal article:
Van Migerode, C., Poorthuis, A., & Derudder, B. (2024). Flexurba: An open-source R package to flexibly reconstruct the Degree of Urbanisation classification. Environment and Planning B: Urban Analytics and City Science, 51(7), 1706-1714.
The flexurba package can be installed as follows:
install.packages("flexurba")Important notes for installation:
The flexurba package uses C++ code for
certain functions. Please make sure to have MAKE
installed on your computer.
While installing the package, R will give a prompt to install Rtools (if not
already installed). Please click YES and make sure you have
appropriate administrator rights.
The DEGURBA methodology classifies the cells of a 1 km² population grid into three different categories based on the following rules (detailed in the GHSL Data Package 2023):
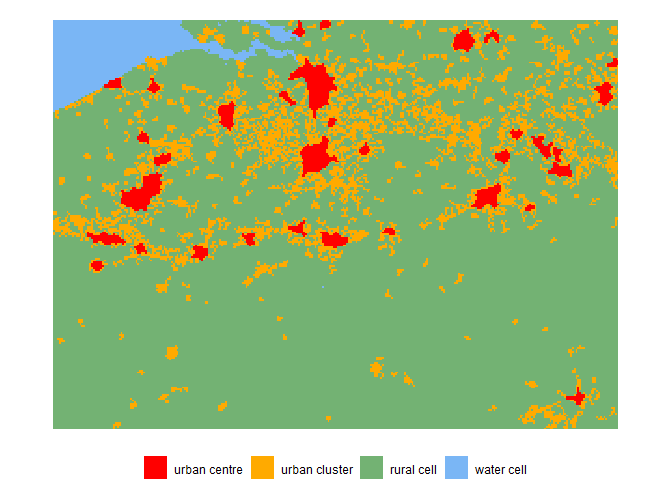
We can reconstruct the standard grid cell classification for Belgium as follows.
library(flexurba)

# load the example data for Belgium
data_belgium <- DoU_load_grid_data_belgium()

# run the DEGURBA algorithm with the standard parameter settings
classification1 <- DoU_classify_grid(data = data_belgium)

# plot the resulting grid
DoU_plot_grid(classification1)
The function DoU_classify_grid() also allows to adapt
the standard parameters in the DEGURBA algorithm. For example, the
population thresholds for urban centres can be adapted by changing the
following parameters:
UC_density_threshold = 1250: the minimum density
threshold for urban centres (UC) is changed to 1250
inhabitants per km² instead of the standard value of 1500 inhabitants
per km².
UC_size_threshold = 60000: the minimum size
threshold for urban centres (UC) is increased from 50 000
inhabitants to 60 000 inhabitants.
# run the algorithm with custom parameter settings
classification2 <- DoU_classify_grid(
  data = data_belgium,
  # here, we can specify custom population thresholds
  parameters = list(
    UC_density_threshold = 1250,
    UC_size_threshold = 60000
  )
)

# plot the resulting grid
DoU_plot_grid(classification2)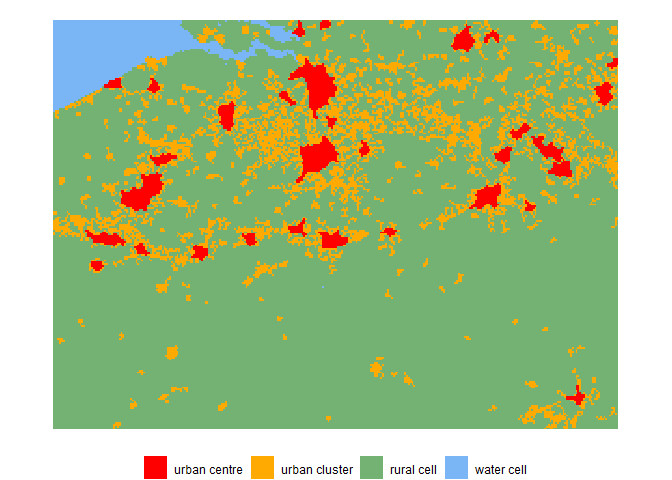
For more information about the possible parameters settings, see the
section ‘Custom specifications’ in the documentation of
DoU_classify_grid().
Apart from DEGURBA, several other delineation approaches enforce
thresholds on gridded datasets. The accompanying flexurbaData
package provides pre-processed datasets that can serve as proxy to
identify urban areas. We can construct urban boundaries based on these
proxy datasets using the function apply_threshold(). The
code examples below enforce a predefined threshold on (1) built-up area
and (2) night-time light data.
# (1) predefined threshold of 15% built-up area

# load the example proxy data for Belgium
proxy_data_belgium <- load_proxies_belgium()

# apply the threshold
builtupclassification <- apply_threshold(proxy_data_belgium$built,
  type = "predefined",
  threshold_value = 0.15
)

# plot the resulting urban boundaries
terra::plot(builtupclassification$rboundaries)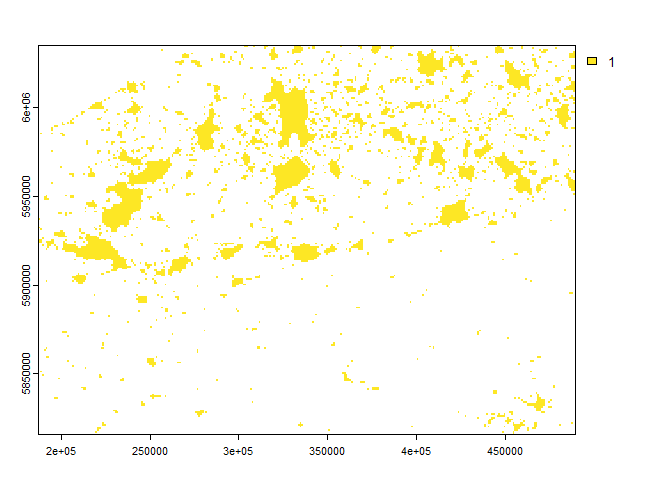
# (2) predefined threshold of 15 nW/cm³/sr

# apply the threshold
lightclassification <- apply_threshold(proxy_data_belgium$light,
  type = "predefined",
  threshold_value = 15
)

# plot the resulting urban boundaries
terra::plot(lightclassification$rboundaries)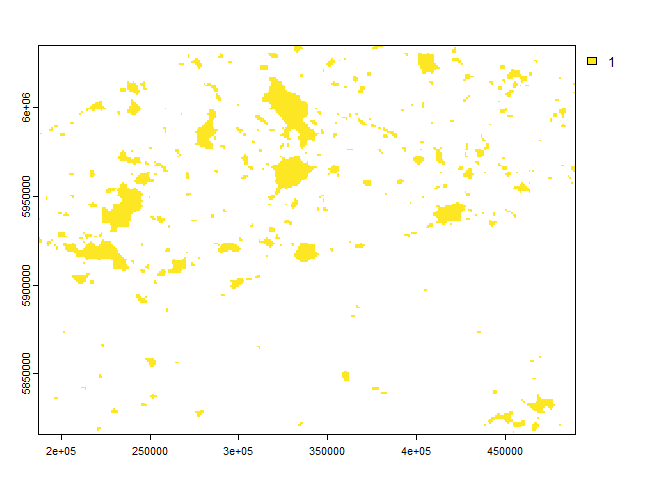
Besides a predefined threshold, the function
apply_threshold() also implements other types of
thresholding approaches. For more information on these, see
vignette("vig8-apply-thresholds").
For more code examples, please consult the documentation pages of the
individual functions. The following vignettes are also available with
more information and workflows using flexurba:
vignette("flexurba") is a “Get Started” tutorial on
using flexurba to reconstruct DEGURBA. It shows how to
download the data from the GHSL website, construct a grid cell
classification and a spatial units classification.vignette("vig1-DoU-level2") showcases how the grid
cell and spatial units classification can be constructed according to
second hierarchical level of DEGURBA.vignette("vig2-DoU-multiple-configurations") gives
an overview on how to use the package to generate multiple alternative
versions of DEGURBA by systematically varying parameters in the
algorithm.vignette("vig3-DoU-global-scale") explains how a
global DEGURBA classification can be established in a memory-efficient
manner.vignette("vig4-DoU-comparison-releases") compares the
method described in Data
Packages 2022 with the method described in Data
Package 2023.vignette("vig5-DoU-computational-requirements")
elaborates on the computational requirements of the package to
reconstruct the DEGURBA classification, and compares the computational
load with the existing GHSL tools.vignette("vig6-DoU-comparison-GHSL-SMOD") compares
the DEGURBA grid classification generated by flexurba with
the official GHSL SMOD
layer and explains few discrepancies between the two
classifications.vignette("vig7-DoU-population-grid") illustrates
how the DEGURBA functionalities can be used with other population grids
(e.g. WorldPop).vignette("vig8-apply-thresholds") elaborates on the
benefits and limitations of different thresholding approach implemented
by the function apply_threshold().vignette("vig9-different-proxies") illustrates how
different proxy datasets can be used to identify urban areas using a
combination of the data in the flexurbaData
package and the functions in the flexurba package.Disclaimer: The flexurba package includes a
reconstruction of DEGURBA’s algorithm, and by no means contains an
official implementation. For the official documents, readers can consult
Dijkstra et
al. (2021), Eurostat
(2021) and the Global Human Settlement
Layer website.
These binaries (installable software) and packages are in development.
They may not be fully stable and should be used with caution. We make no claims about them.