The hardware and bandwidth for this mirror is donated by METANET, the Webhosting and Full Service-Cloud Provider.
If you wish to report a bug, or if you are interested in having us mirror your free-software or open-source project, please feel free to contact us at mirror[@]metanet.ch.
The goal of freqdistributionNogives is to automate the process of GROUPED FREQUENCY DISTRIBUTION data-framing and cumulative frequency graph.
You can install the development version of freqdistributionNogives like so: The Public Repository can be accessed in the following manner:-
# FILL THIS IN! HOW CAN PEOPLE INSTALL YOUR DEV PACKAGE?
Development Package Link :- https://github.com/Harshit-Budakoti/packagetest
1)Install the package devtools in Rstudio.
install.packages(devtools)
2)Run the code given below to install the Development Version Repository using
##devtools::install_github('Harshit-Budakoti/packagetest')
3) After installation:-
use the function basicfreqdist(lowerclasslimits,upperclasslimits,frequencies)
The working of the packages has been illustrated using an example.This is a basic example which shows you how to use this package to get automated frequency distribution table with cumulative frequencies and cumulative frequency plot:
library(freqdistributionNogives)
lowerlimits=c(0,5,10,15,20,25)
upperlimits=c(5,10,15,20,25,30)
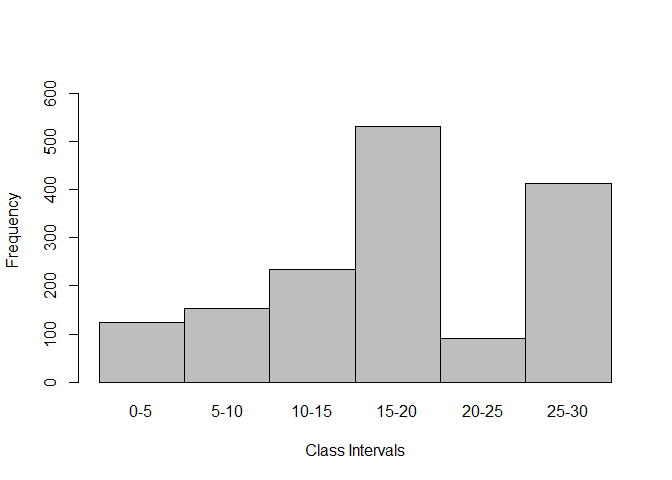
frequencies=c(124,153,234,531,91,414)
basicfreqdist(lowerlimits,upperlimits,frequencies)
#>   LL UL classmark freq morecf lesscf
#> 1  0  5       2.5  124   1547    124
#> 2  5 10       7.5  153   1423    277
#> 3 10 15      12.5  234   1270    511
#> 4 15 20      17.5  531   1036   1042
#> 5 20 25      22.5   91    505   1133
#> 6 25 30      27.5  414    414   1547

## basic example code
```
The figure given below gives us the Histogram plot of the given data

These binaries (installable software) and packages are in development.
They may not be fully stable and should be used with caution. We make no claims about them.