The hardware and bandwidth for this mirror is donated by METANET, the Webhosting and Full Service-Cloud Provider.
If you wish to report a bug, or if you are interested in having us mirror your free-software or open-source project, please feel free to contact us at mirror[@]metanet.ch.

Interactive Cartography (htmlwidget)
geovizr is an R package for thematic mapping. It’s an R wrapper around the geoviz JavaScript library, itself based on the d3.js ecosystem. Like the original JavaScript library, the package can be used to create a wide range of interactive, zoomable vector maps, taking advantage of d3’s many features: proportional symbols, pictograms, typologies, choropleth maps, spikes, tiles, Dorling cartograms, etc. It can also be used to create pretty static vectorial maps in SVG format, suitable for editorial cartography.
You can install the released version of geovizr from
CRAN with:
install.packages("geovizr")Alternatively, you can install the development version of
geovizr from r-universe with:
install.packages("geovizr", repos = c("https://riatelab.r-universe.dev", "https://cloud.r-project.org"))Creating a map with geovizr requires chaining several
functions. The create() function initializes a map with
general parameters. Then, functions such as outline(),
graticule(), path(), and many others allow you
to add and refine layers. Finally, the render() function
displays the map. Here are a few examples.
First, let’s load some data
library(sf)
world <- st_read(
  system.file("gpkg/world.gpkg", package = "geovizr"),
  quiet = TRUE
)viz_create(projection = "InterruptedMollweide", zoomable = TRUE) |>
viz_outline() |>
viz_graticule(stroke = "white") |>
viz_path(data = world, fill = "#38896F", tip = "$NAMEen") |>
viz_render()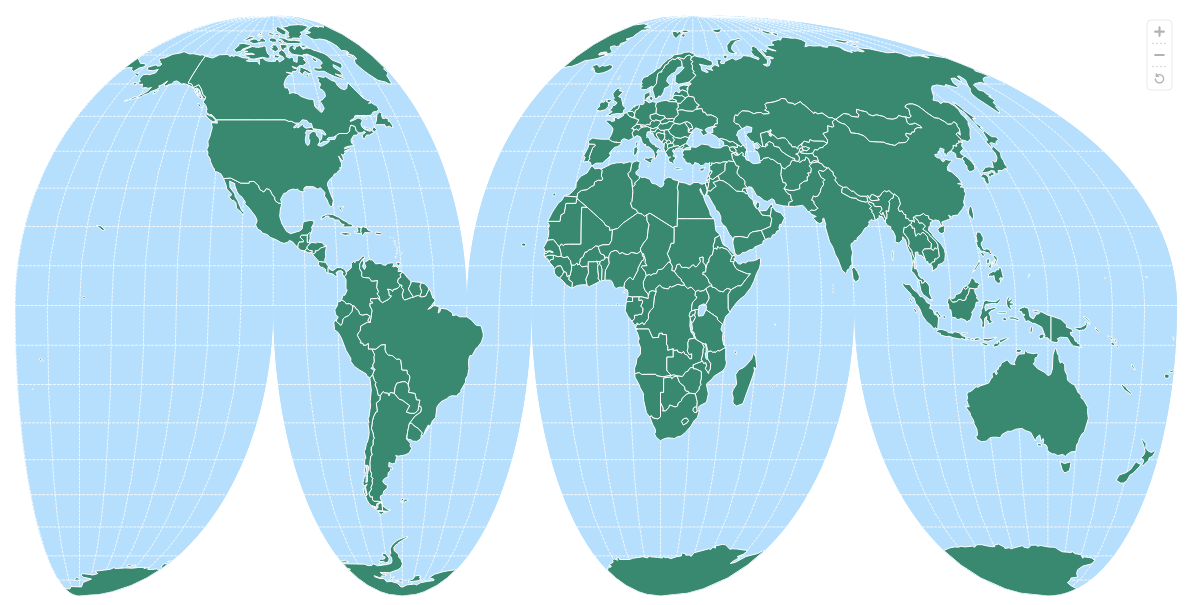
viz_create(projection = "InterruptedMollweide", zoomable = TRUE) |>
  viz_outline() |>
  viz_graticule(stroke = "white") |>
  viz_path(data = world, fill = "#CCC") |>
  viz_prop(data = world, var = "pop", fill = "#38896F",
           leg_pos = c(60, 300),
           leg_values_factor = 1/1000000,
           leg_values_round = 0,
           leg_title  = "Population",
           leg_subtitle = "(million inh.)"
           ) |>
  viz_render()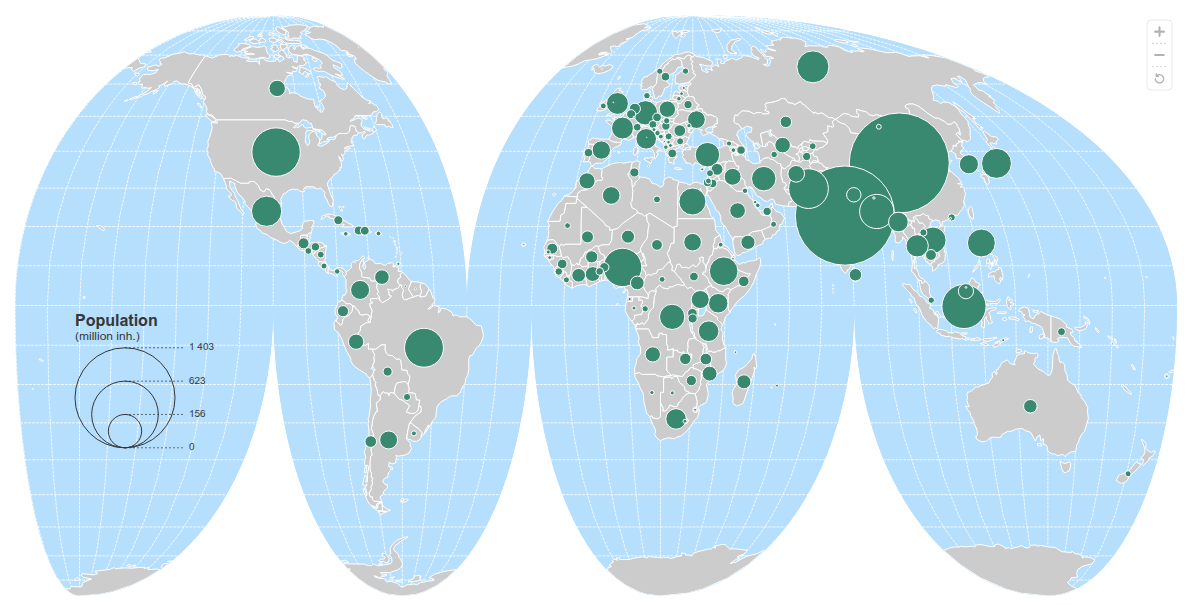
viz_create(projection = "InterruptedMollweide", zoomable = TRUE) |>
  viz_outline() |>
  viz_graticule(stroke = "white") |>
  viz_path(data = world, fill = "#CCC") |>
  viz_choro(data = world, var = "gdppc",
            colors = "Peach",
            leg_title  = "GDP per capita",
            leg_subtitle = "(in $)",
            leg_values_round = 0,
            leg_pos = c(60, 300)
            ) |>
  viz_render()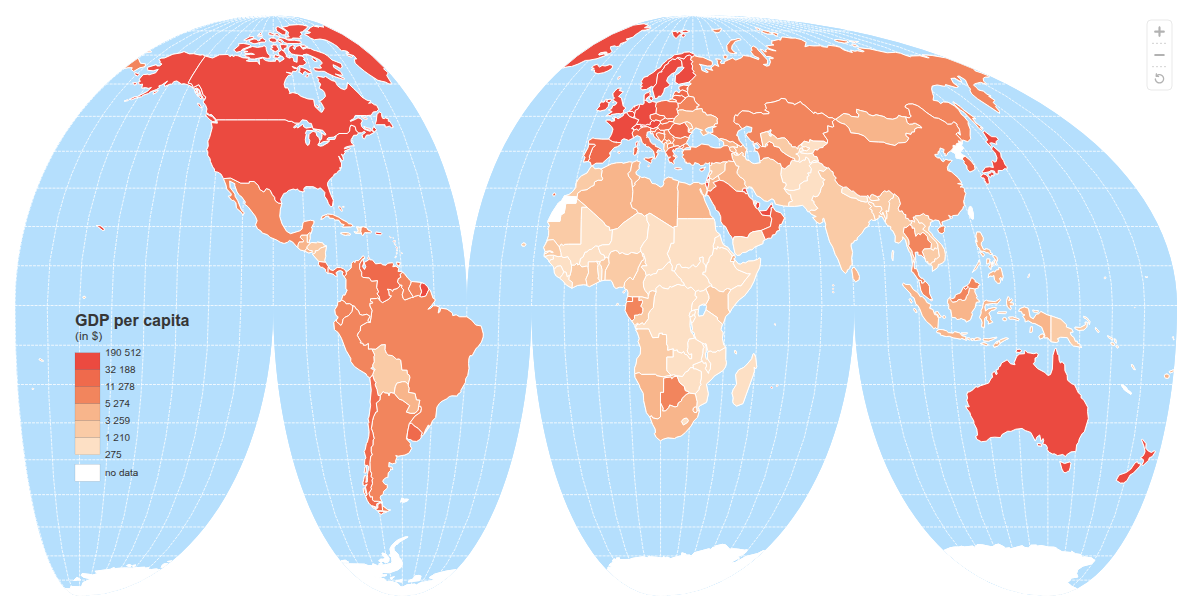
geovizr is not intended to compete with other mapping
packages in R, such as mapsf or tmap. It really
focuses on the html / interactive geovisualisation.
One can contribute to the package through pull requests and report issues or ask questions here.
These binaries (installable software) and packages are in development.
They may not be fully stable and should be used with caution. We make no claims about them.