The hardware and bandwidth for this mirror is donated by METANET, the Webhosting and Full Service-Cloud Provider.
If you wish to report a bug, or if you are interested in having us mirror your free-software or open-source project, please feel free to contact us at mirror[@]metanet.ch.

![]()
![]()
![]()


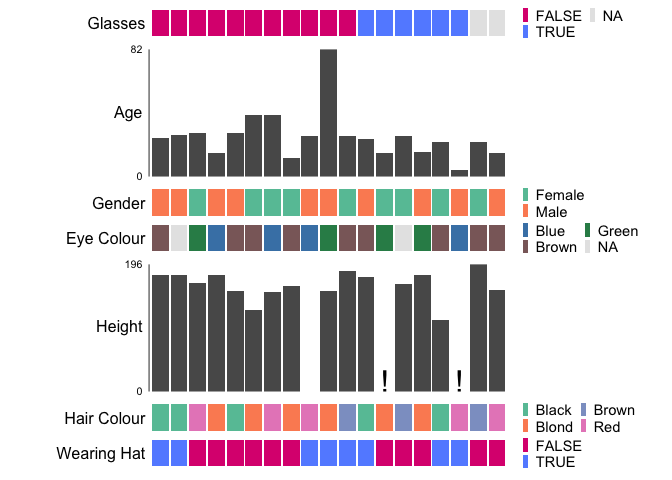
ggEDA streamlines exploratory data analysis by providing turnkey approaches to visualising n-dimensional data which can graphically reveal correlative or associative relationships between two or more features:
To create ggEDA visualisations through a shiny app see interactiveEDA
install.packages("ggEDA")You can install the development version of ggEDA from GitHub with:
if (!require("remotes"))
    install.packages("remotes")

remotes::install_github("CCICB/ggEDA")
Or from R-universe with:
install.packages("ggEDA", repos = "https://ropensci.r-universe.dev")For examples of interactive EDA plots see the ggEDA gallery
# Load library
library(ggEDA)

# Plot data, sort by Glasses
ggstack(
  baseballfans,
  col_id = "ID",
  col_sort = "Glasses",
  interactive = FALSE,
  verbose = FALSE,
  options = ggstack_options(legend_nrow = 2)
)
Customise colours by supplying a named list to the
palettes argument
ggstack(
  baseballfans,
  col_id = "ID",
  col_sort = "Glasses",
  palettes = list("EyeColour" = c(
    Brown = "rosybrown4",
    Blue = "steelblue",
    Green = "seagreen"
  )),
  interactive = FALSE,
  verbose = FALSE,
  options = ggstack_options(legend_nrow = 2)
)
Infinite values in numeric colums are indicated with directional (↓
& ↑) arrows to differentiate them from missing (NA) values which are
represented by !.
data <- data.frame(
  numbers = c(1:3, Inf, -Inf, NA),
  letters = LETTERS[1:6]
)

ggstack(data, interactive = FALSE, verbose = FALSE)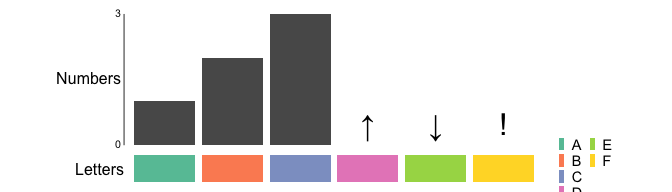
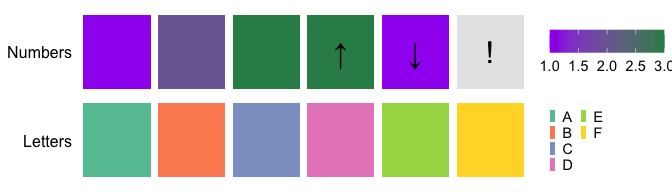
If rendering numeric columns as heatmaps, infinite values are clamped
to the min/max colours, while na values remain grey. We can optionally
add markers by setting show_na_marker_heatmap = TRUE
ggstack(
  data,
  interactive = FALSE,
  verbose = FALSE,
  options = ggstack_options(numeric_plot_type = "heatmap", show_na_marker_heatmap = TRUE)
)
For datasets with many observations and mostly numeric features, parallel coordinate plots may be more appropriate.
ggparallel(
 data = minibeans,
 col_colour = "Class",
 order_columns_by = "auto",
 interactive = FALSE
)
#> ℹ Ordering columns based on mutual information with [Class]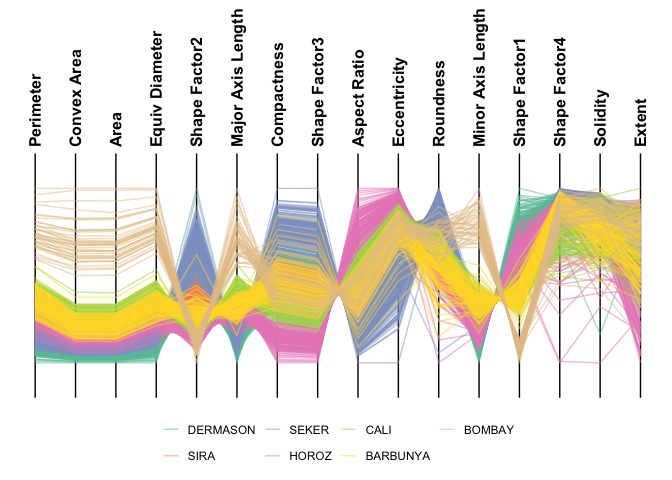
 ggparallel(
   data = minibeans,
   col_colour = "Class",
   highlight = "DERMASON",
   order_columns_by = "auto",
   interactive = FALSE
 )
#> ℹ Ordering columns based on how well they differentiate 1 group from the rest [DERMASON] (based on mutual information)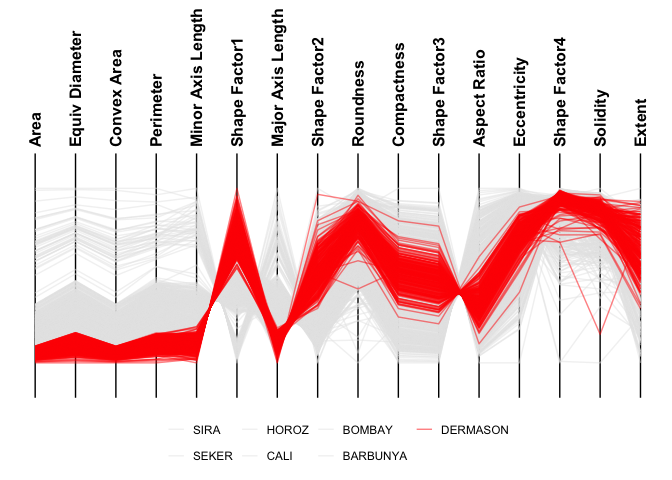
 ggparallel(
   data = minibeans,
   order_columns_by = "auto",
   interactive = FALSE
 )
#> ℹ To add colour to plot set `col_colour` to one of: Class
#> ℹ Ordering columns to minimise crossings
#> ℹ Choosing axis order via repetitive nearest neighbour with two-opt refinement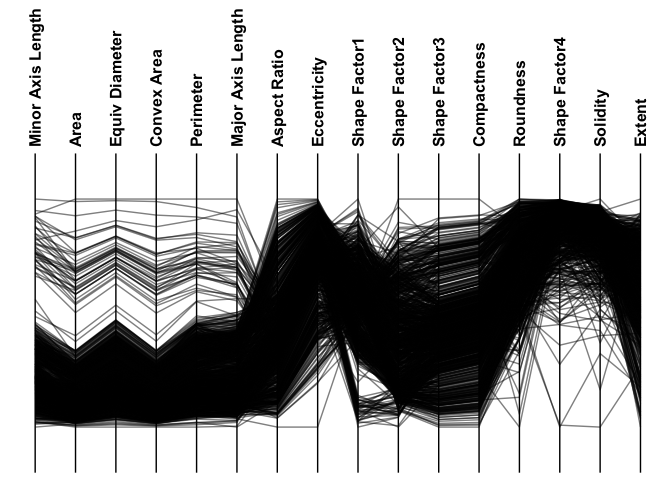
All types of contributions are encouraged and valued. See our guide to community contributions for different ways to help.
These binaries (installable software) and packages are in development.
They may not be fully stable and should be used with caution. We make no claims about them.