The hardware and bandwidth for this mirror is donated by METANET, the Webhosting and Full Service-Cloud Provider.
If you wish to report a bug, or if you are interested in having us mirror your free-software or open-source project, please feel free to contact us at mirror[@]metanet.ch.

{ggflowchart} is an R package for producing flowcharts using {ggplot2}.
Install the package from CRAN using:
install.packages("ggflowchart")or install the development version from GitHub:
remotes::install_github("nrennie/ggflowchart")The idea of {ggflowchart} is to create simple flowcharts with minimal
effort. Currently, all flowcharts are constructed using the
ggflowchart() function. For the most basic flowchart, it
takes as input a data frame containing (at least) two columns for the
start and end points of the edges in the flowchart.
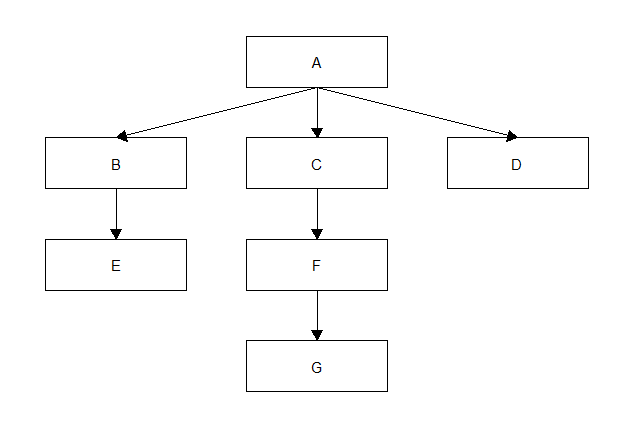
data <- tibble::tibble(from = c("A", "A", "A", "B", "C", "F"),
                       to = c("B", "C", "D", "E", "F", "G"))
The flowchart is then created using ggflowchart().
ggflowchart(data)
See vignettes for further examples of usage.
Note: this package is currently a work-in-progress. Upcoming features that are currently listed as issues being worked on include:
colour based on node
attributes.linetype and colour of arrows
based on edge attributes.If you have a suggestion of an additional feature, or find a bug, please file an issue on the GitHub repository.
These binaries (installable software) and packages are in development.
They may not be fully stable and should be used with caution. We make no claims about them.