The hardware and bandwidth for this mirror is donated by METANET, the Webhosting and Full Service-Cloud Provider.
If you wish to report a bug, or if you are interested in having us mirror your free-software or open-source project, please feel free to contact us at mirror[@]metanet.ch.
![]()
![]()
ggforestplotR provides a ggplot2-first
workflow for building forest plots from tidy coefficient tables or
fitted model objects.
install.packages("ggforestplotR")#install.packages("remotes")
remotes::install_github("thatoneguy006/ggforestplotR")ggforestplotR currently supports two core workflows:
library(ggforestplotR)
library(ggplot2)
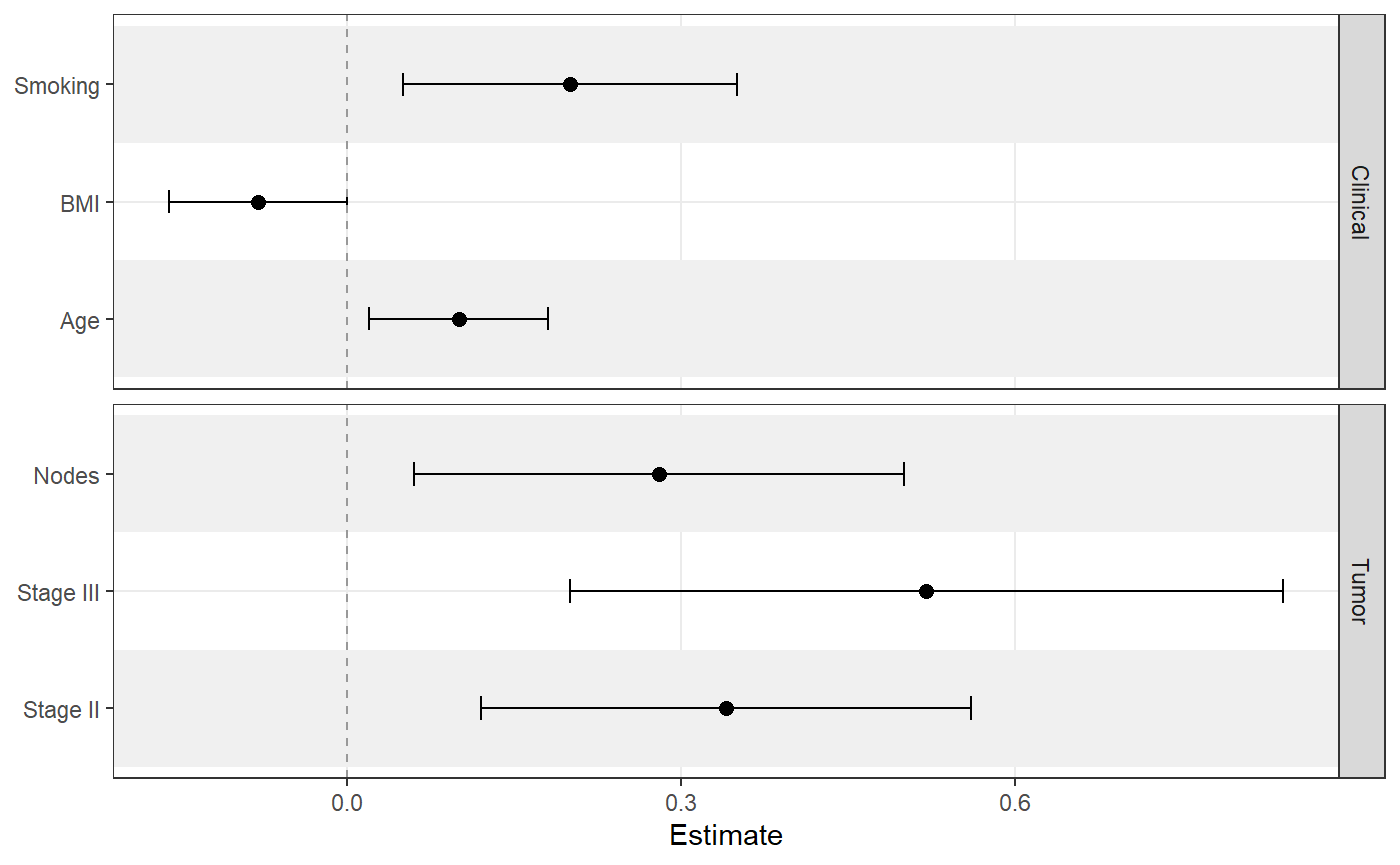
sectioned_coefs <- data.frame(
term = c("Age", "BMI", "Smoking", "Stage II", "Stage III", "Nodes"),
estimate = c(0.10, -0.08, 0.20, 0.34, 0.52, 0.28),
conf.low = c(0.02, -0.16, 0.05, 0.12, 0.20, 0.06),
conf.high = c(0.18, 0.00, 0.35, 0.56, 0.84, 0.50),
section = c("Clinical", "Clinical", "Clinical", "Tumor", "Tumor", "Tumor")
)
ggforestplot(
sectioned_coefs,
facet = "section",
striped_rows = TRUE,
stripe_fill = "grey94",
facet_strip_position = "right"
)
ggforestplot(
  sectioned_coefs,
  striped_rows = TRUE,
  stripe_fill = "grey94"
) +
  add_forest_table()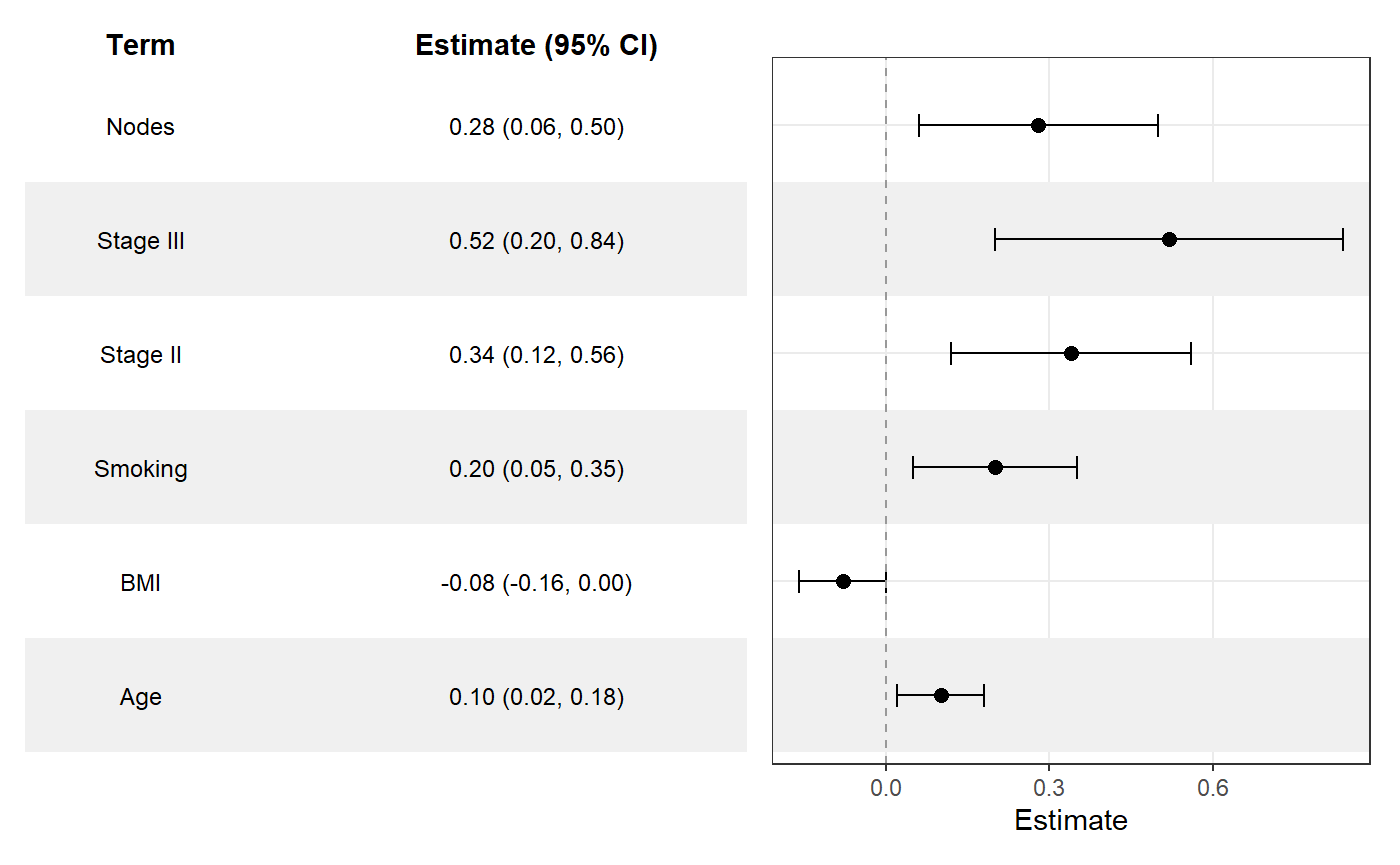
ggforestplot(
  sectioned_coefs,
  striped_rows = TRUE,
  stripe_fill = "grey94"
) +
  add_split_table()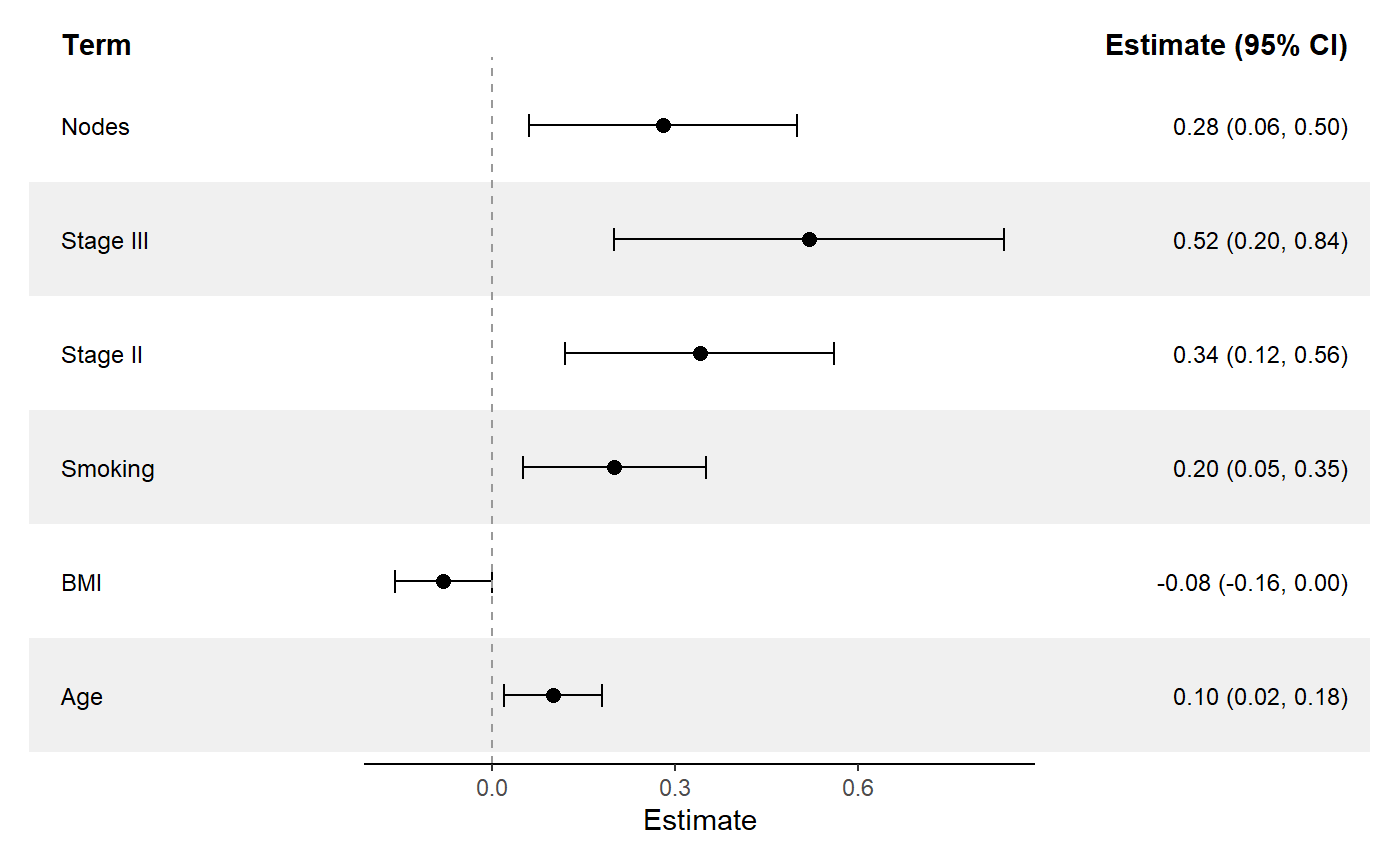
ggforestplot() builds the plotting panel from a data
frame or supported model object.add_forest_table() attaches a summary table to the left
or right side of the plot.add_split_table() creates a more traditional forestplot
layout with table columns on both sides of the plot.as_forest_data() standardizes custom coefficient
data.tidy_forest_model() converts fitted models into
plotting-ready coefficient data.These binaries (installable software) and packages are in development.
They may not be fully stable and should be used with caution. We make no claims about them.