The hardware and bandwidth for this mirror is donated by METANET, the Webhosting and Full Service-Cloud Provider.
If you wish to report a bug, or if you are interested in having us mirror your free-software or open-source project, please feel free to contact us at mirror[@]metanet.ch.
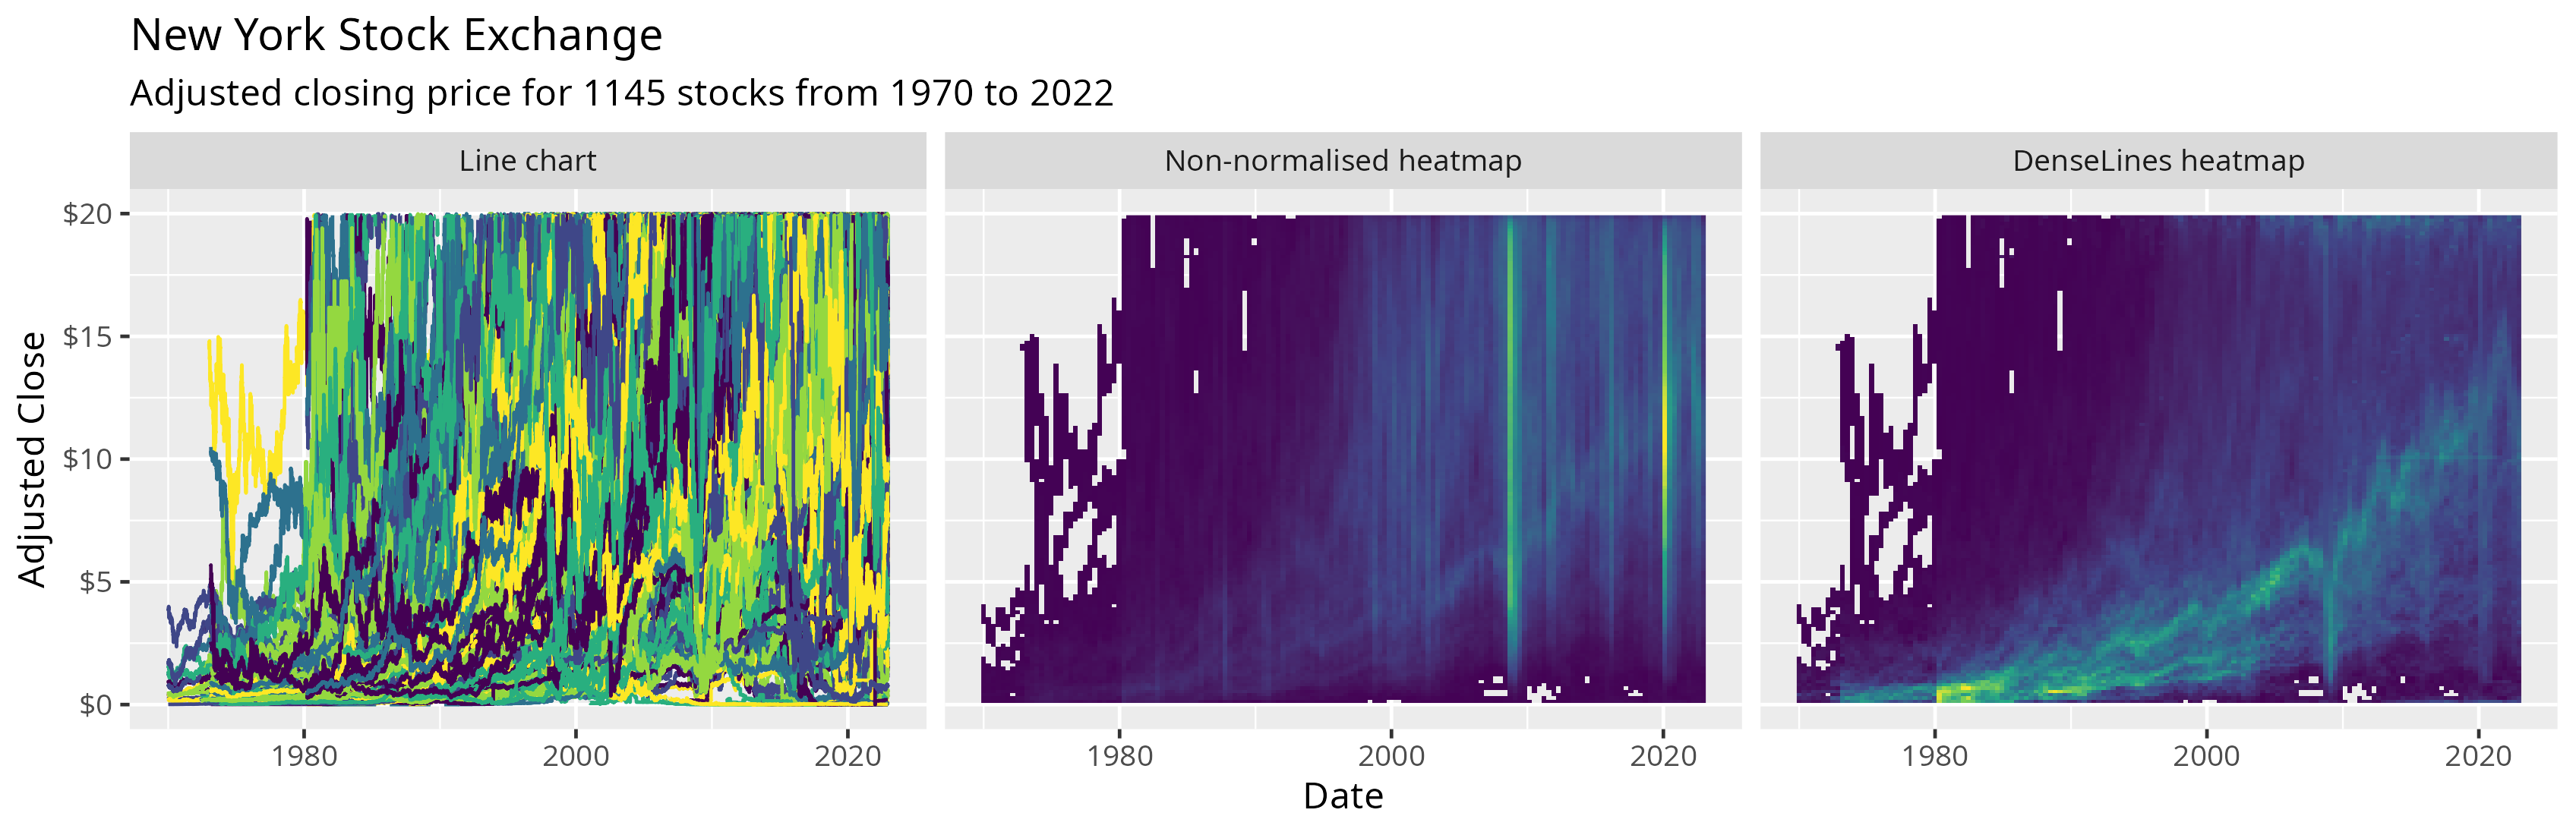
The goal of gglinedensity is to bring the DenseLines algorithm to R via ggplot2, providing a “derived density visualisation (that) allows users both to see the aggregate trends of multiple (time) series and to identify anomalous extrema” (Moritz and Fisher, 2018).
You can install gglinedensity like so:
install.packages("gglinedensity")You can install the development version of gglinedensity like so:
# install.packages("pak")
pak::pak("hrryt/gglinedensity")This is a basic example which shows you how to create a DenseLines heatmap:
library(ggplot2)
library(gglinedensity)

ggplot(txhousing, aes(date, median, group = city)) +
  stat_line_density(bins = 50, drop = FALSE, na.rm = TRUE)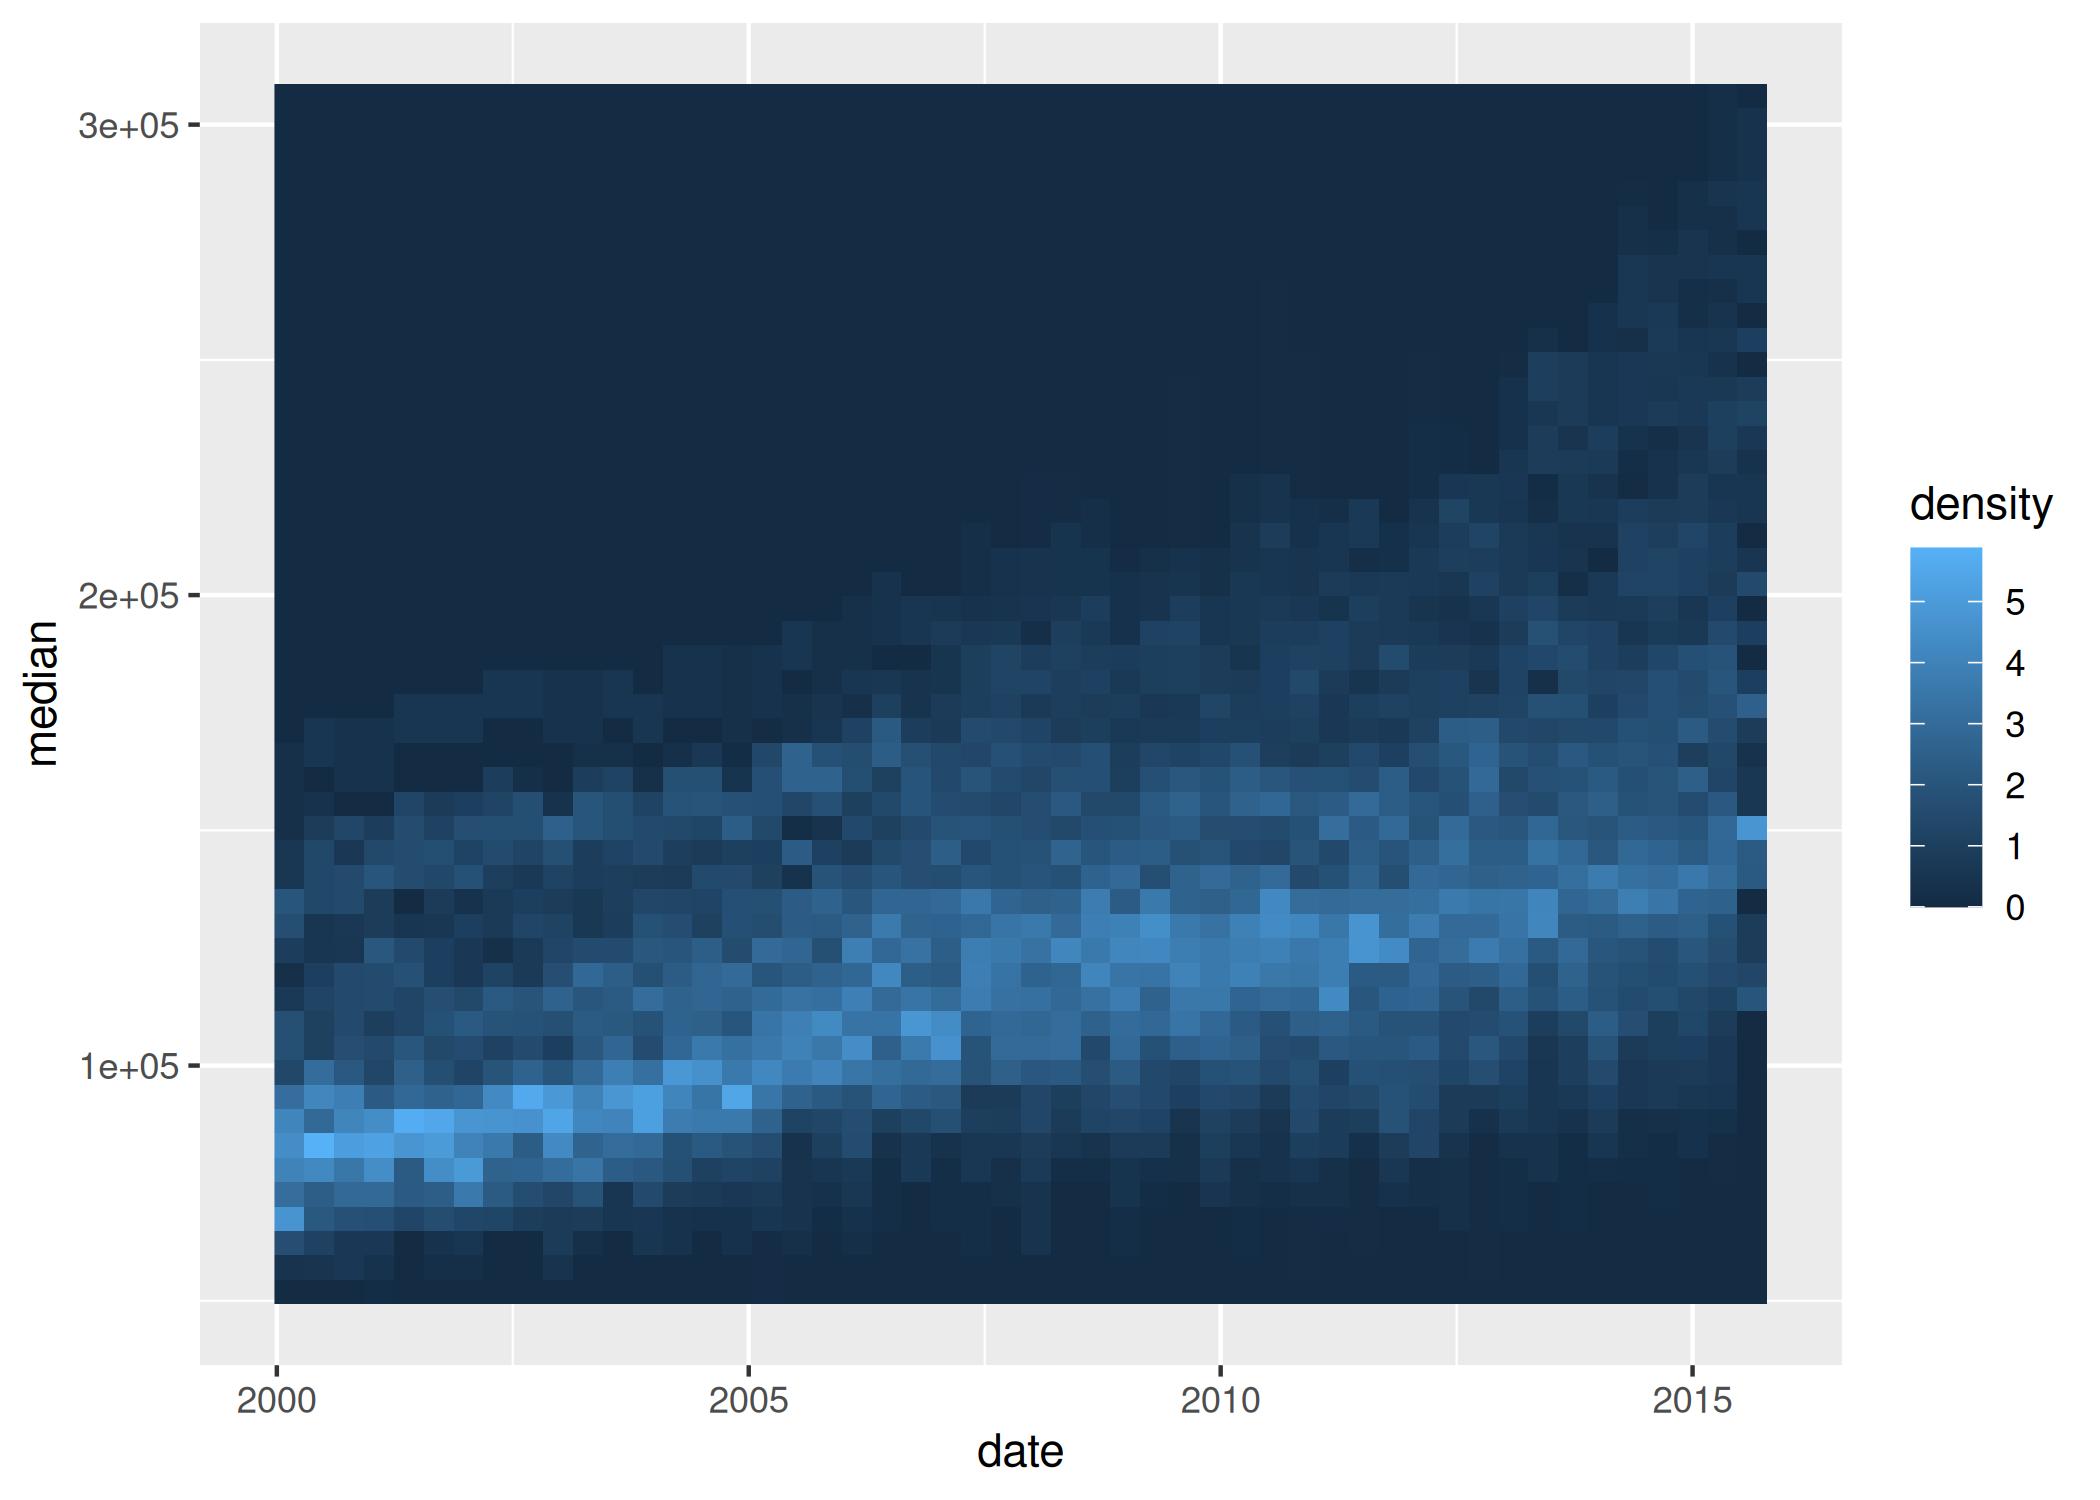
You can also calculate the number of paths crossing a given bin, without using the DenseLines algorithm:
ggplot(dplyr::storms, aes(long, lat, group = name)) +
    borders(colour = NA, fill = "grey50") +
    stat_path_density(geom = "tile", binwidth = 1.25, na.rm = TRUE) +
    borders() +
    xlim(-180, 0) +
    ylim(-40, 80) +
    coord_sf(
        crs = sf::st_crs(5070),
        default_crs = sf::st_crs(4326),
        xlim = c(-120, -30), ylim = c(0, 70)
    ) +
    theme(panel.background = element_rect(fill = "grey10"))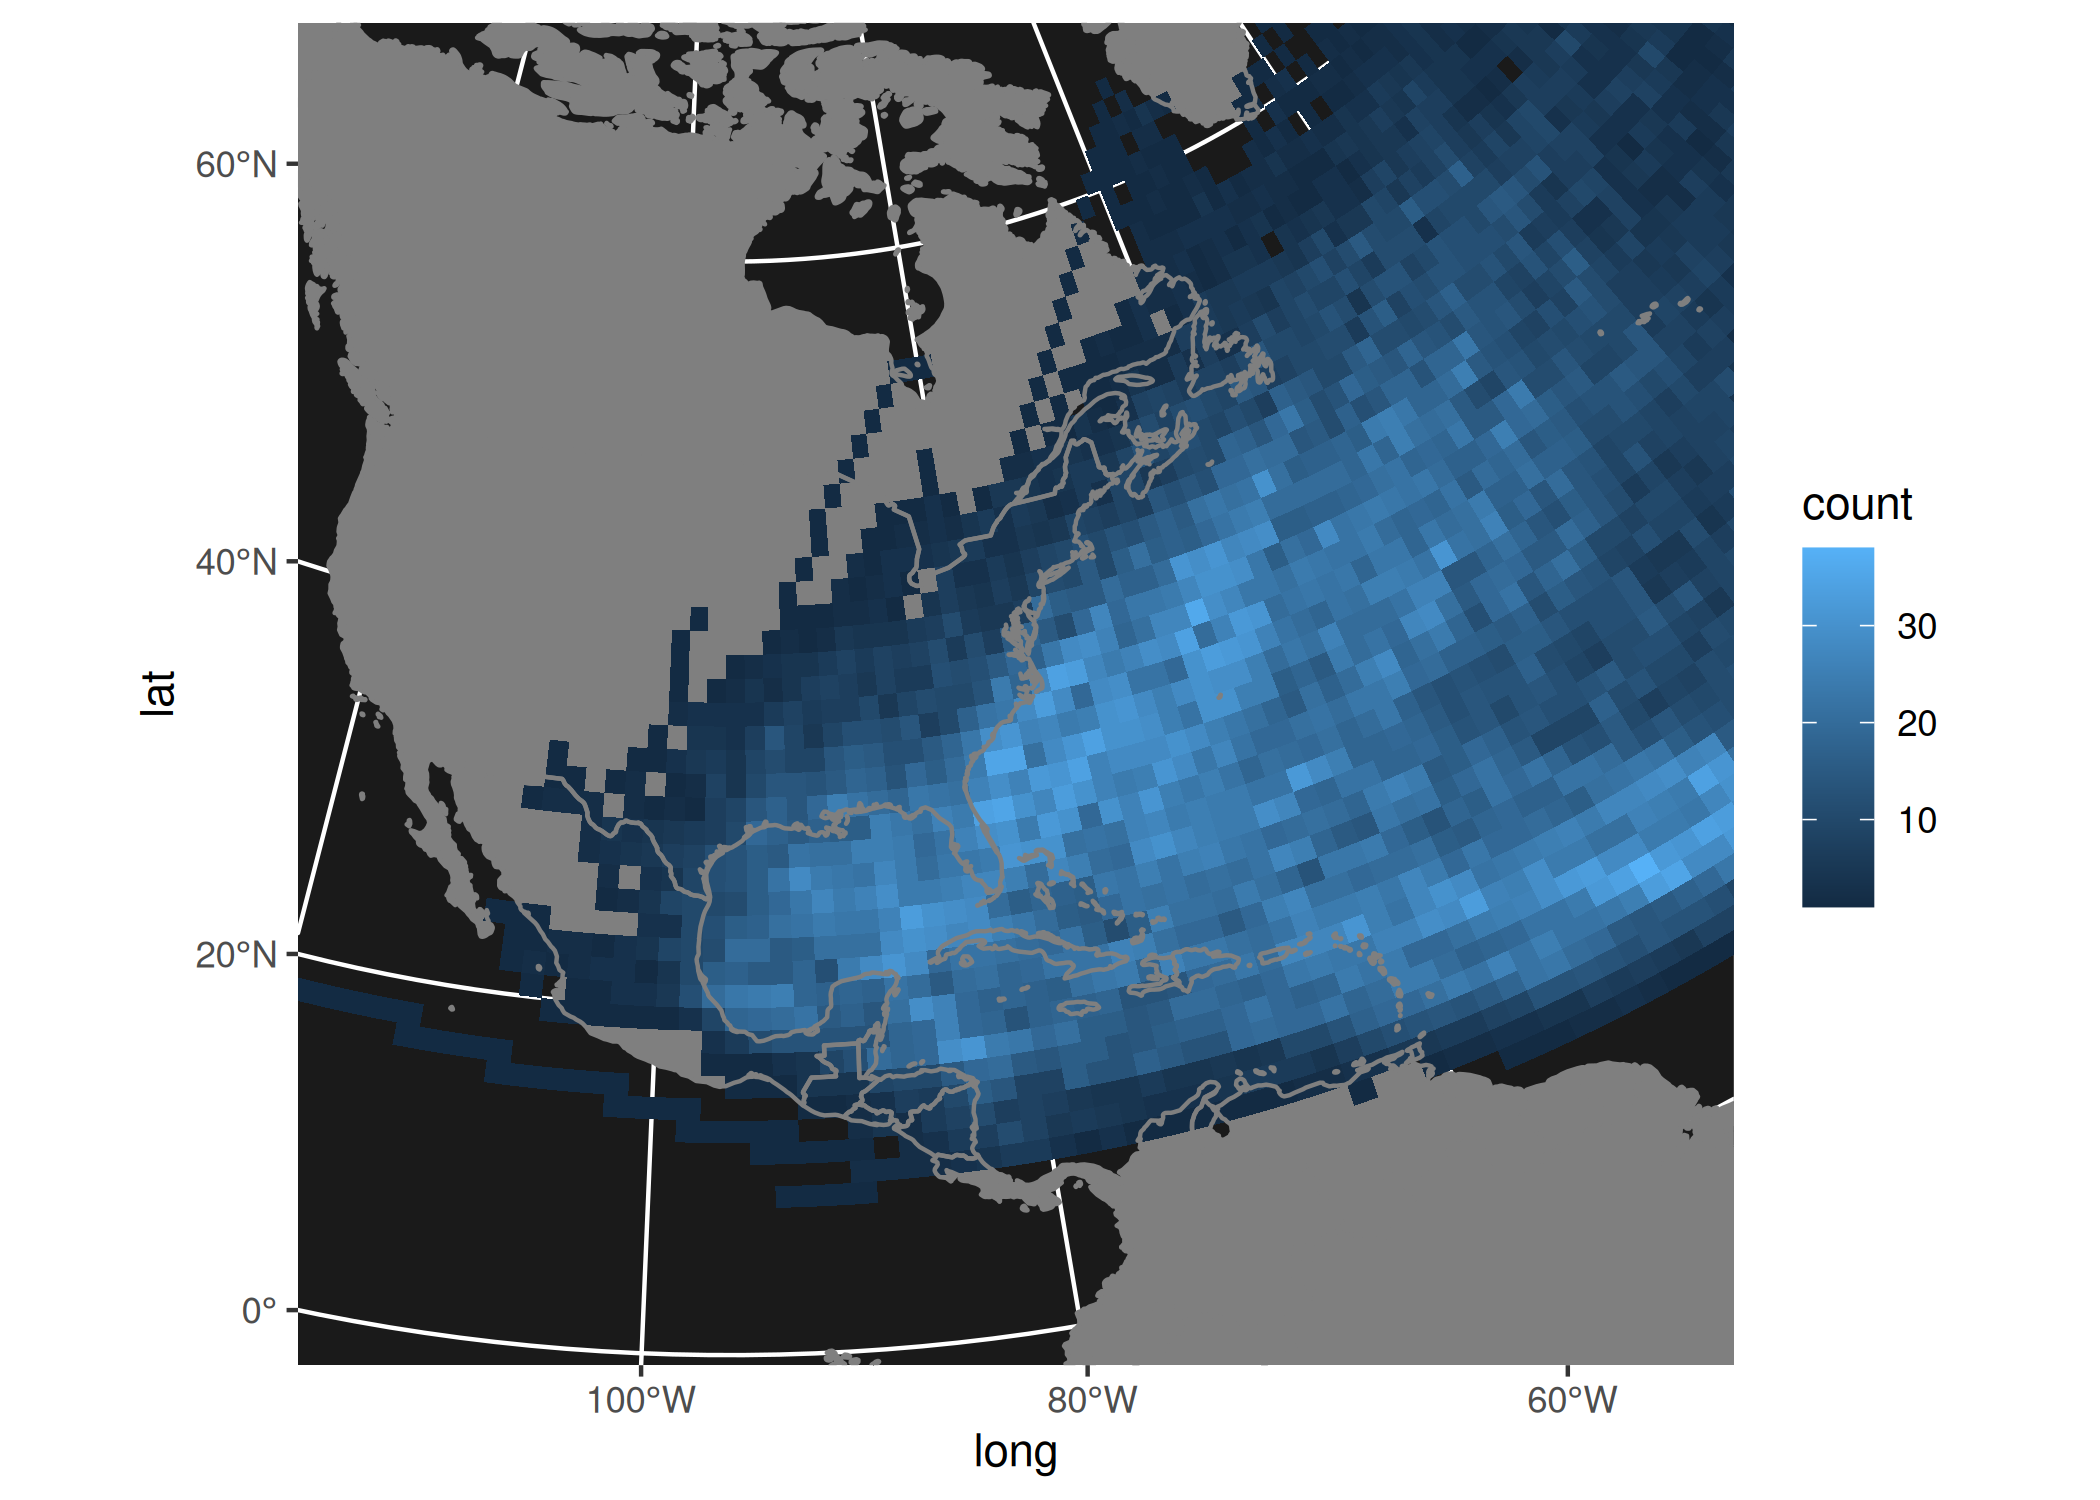
These binaries (installable software) and packages are in development.
They may not be fully stable and should be used with caution. We make no claims about them.