The hardware and bandwidth for this mirror is donated by METANET, the Webhosting and Full Service-Cloud Provider.
If you wish to report a bug, or if you are interested in having us mirror your free-software or open-source project, please feel free to contact us at mirror[@]metanet.ch.
![]()
![]()
A collection of easy-to-use custom ggplot2-based functions for data exploration and analysis. Each function handles data preprocessing and returns a ggplot2 object that can be further customized using standard ggplot2 syntax. Includes general-purpose and domain-specific visualizations.
General:
General-purpose visualizations
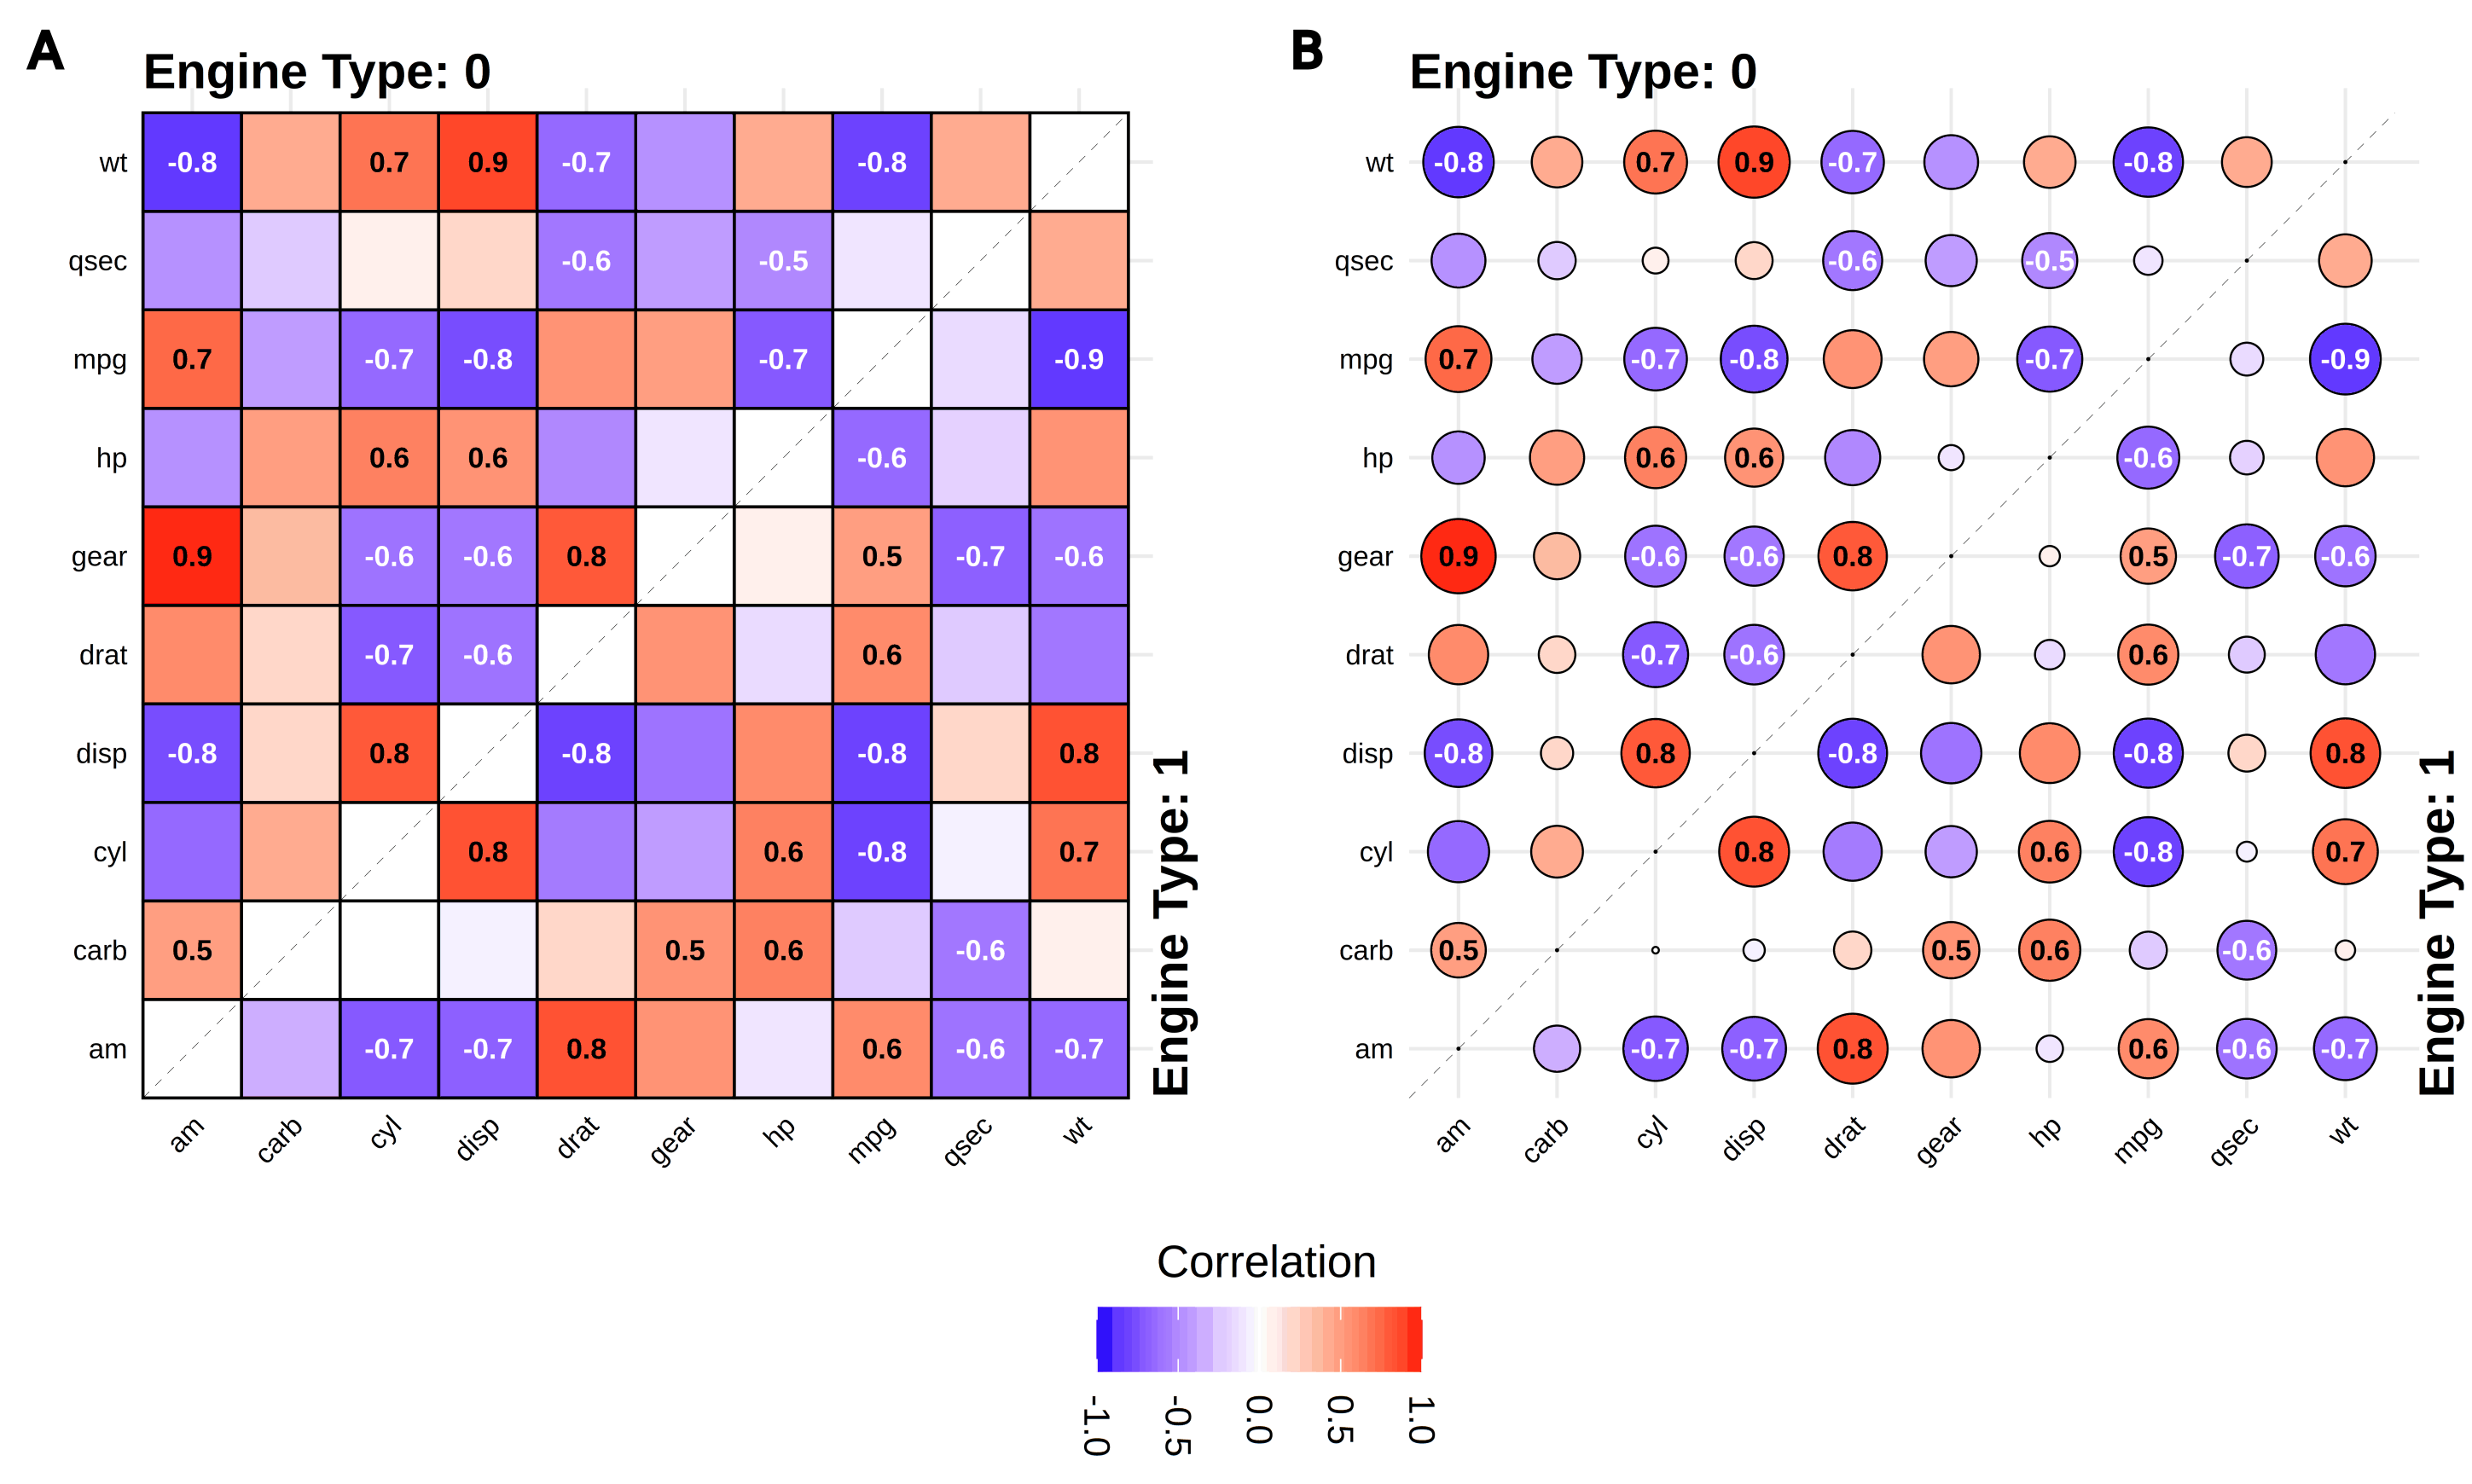
gg_splitcorr()
- Split-Correlation Heatmapgg_rankshift()
- Paired box-/bar- plots with rank changegg_criteria()
- Criteria heatmap with optional barplotsgg_conf()
- Confusion/contingency table bubble plotBioinformatics:
Sequence analysis and genomics visualizations
gg_geno()
- Biallelic genotype visualization with split tiles and optional
barplotsgg_seq()
- Sequence coverage plot with region highlightinggg_seqdiff()
- Sequence alignment showing only differencesgg_biodist()
- Biodistribution plots with easy free-scale facetingChemoinformatics:
Binding kinetics and drug discovery visualizations
gg_kdmap()
- Kinetic rate maps (association/dissociation) with iso-affinity
linesInstall from CRAN:
# currently unavailable - initial submission in progress
install.packages("ggrecipes")
Development version from GitHub:
# install.packages("devtools")
devtools::install_github("Ignophi/ggrecipes")If you use ggrecipes in your work, please cite:
[Citation information will be added upon publication]MIT License - see LICENSE file for details.
These binaries (installable software) and packages are in development.
They may not be fully stable and should be used with caution. We make no claims about them.