The hardware and bandwidth for this mirror is donated by METANET, the Webhosting and Full Service-Cloud Provider.
If you wish to report a bug, or if you are interested in having us mirror your free-software or open-source project, please feel free to contact us at mirror[@]metanet.ch.
![]()
![]()
The ggtime package extends the capabilities of ‘ggplot2’ by providing grammatical elements and plot helpers designed for visualizing time series patterns. These functions use calendar structures implemented in the mixtime package to help explore common time series patterns including trend, seasonality, cycles, and holidays.
The plot helper functions make use of the tsibble data format in order to quickly and easily produce common time series plots. These plots can also be constructed with the underlying grammar elements, which allows greater flexibility in producing custom time series visualisations.
You can install the stable version from CRAN:
install.packages("ggtime")You can install the development version of ggtime from GitHub with:
# install.packages("remotes")
remotes::install_github("mitchelloharawild/ggtime")The simplest time series visualisation is the time plot, which shows
time continuously on the x-axis with the measured variables on the
y-axis. A time plot is useful for identifying patterns that persist over
a long period of time, such as trends and seasonality. A time plot can
be created from a tsibble with the autoplot() helper
function.
library(ggtime)
library(ggplot2)
library(tsibble)

tsibbledata::aus_production |>
  autoplot(Beer)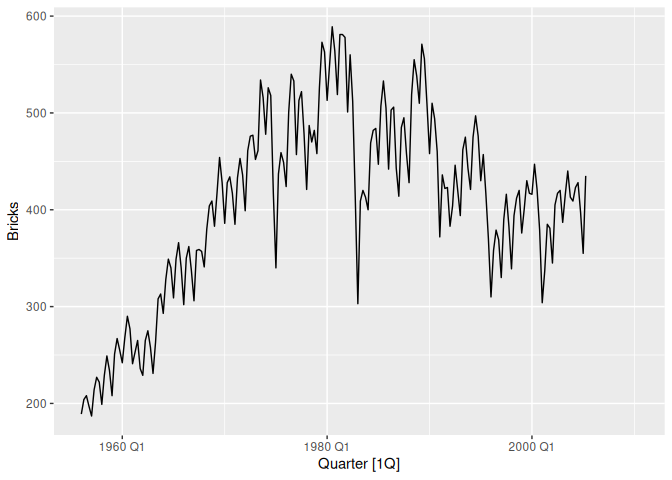
A time plot can also be constructed with the underlying grammar
elements, which allows greater flexibility in the style and appearance
of the plot. The geom_time_line() element is a time-aware
extension of ggplot2::geom_line() that ensures line slopes
accurately represent rates of change even over timezone changes, gaps,
and duplicated time points.
tsibbledata::aus_production |>
  ggplot(aes(x = Quarter, y = Beer)) +
  geom_time_line(colour = "steelblue")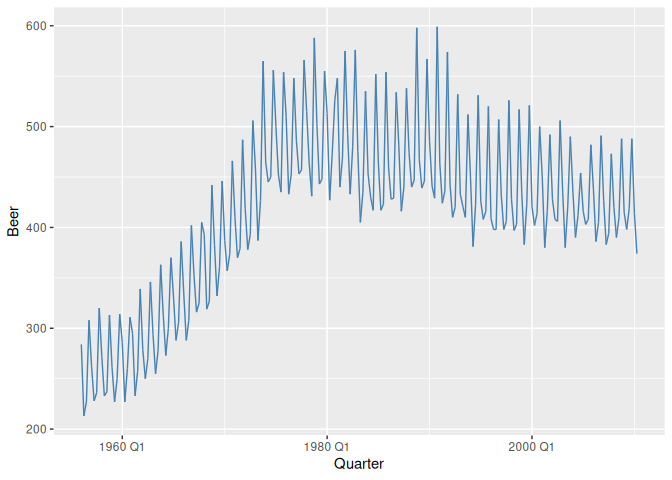
To view the shape of the annual seasonal pattern, it is useful to use
a seasonal plot which shows time cyclically on the x-axis. This makes it
easier to identify the peaks, troughs, and overall shape of the
seasonality. A seasonal plot is created from a tsibble with the
gg_season() plot helper function.
tsibbledata::aus_production |>
  gg_season(Beer)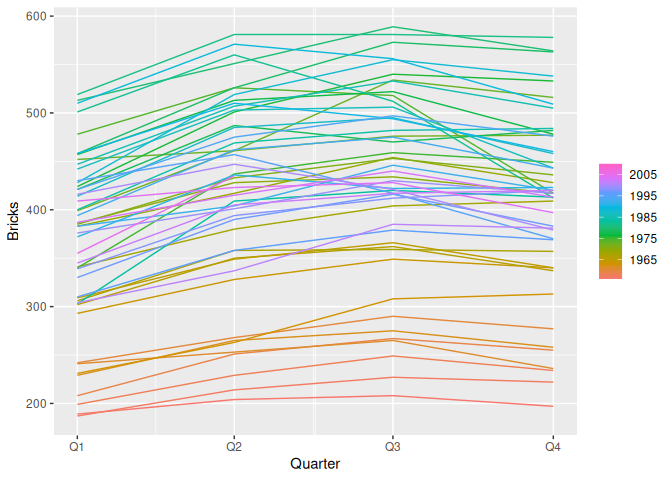
These binaries (installable software) and packages are in development.
They may not be fully stable and should be used with caution. We make no claims about them.