The hardware and bandwidth for this mirror is donated by METANET, the Webhosting and Full Service-Cloud Provider.
If you wish to report a bug, or if you are interested in having us mirror your free-software or open-source project, please feel free to contact us at mirror[@]metanet.ch.
![]()
The goal of graphonmix is to generate dense or sparse graphs via different techniques. We explore \((U,W)\)-mixture graphs and graphettes. \((U,W)\)-mixture graphs are generated from a standard dense graphon \(W\) and a disjoint clique graphon \(U\), which acts as the sparse graph generator. Graphettes are a triple consisting of a graphon \(W\), a sparsifing sequence \(\{\rho_n\}_n\) with \(\rho_n \to 0\) and graph edit function \(f\). \((U,W)\)-mixture graphs are discussed in (Kandanaarachchi and Ong 2026) and graphettes are discussed in (Wijesinghe et al. 2026).
You can install the development version of graphonmix from GitHub with:
# install.packages("pak")
pak::pak("sevvandi/graphonmix")This is a basic example on how to sample a \((U,W)\)-mixture graph.
library(graphonmix)
library(igraph)
#>
#> Attaching package: 'igraph'
#> The following objects are masked from 'package:stats':
#>
#> decompose, spectrum
#> The following object is masked from 'package:base':
#>
#> union
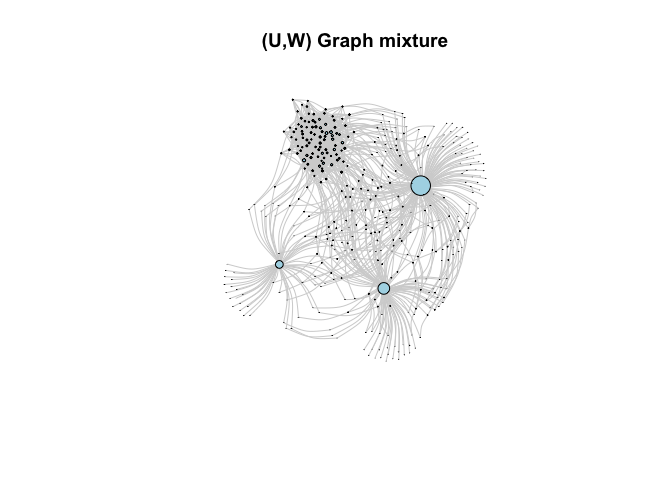
# create the dense graphon W(x,y) = 0.1
W <- matrix(0.1, nrow = 100, ncol = 100)
# create the sparse part - a disjoint set of stars
wts <- c(0.5, 0.3, 0.2)
# single function to generate a graph mixture
gr1 <- sample_mixed_graph(W, wts, nd = 100, ns = 300, p = 0.5, option = 2)
plot(gr1,
edge.curved = 0.3,
vertex.size = degree(gr1)*0.1,
edge.color = "lightgray", # Light colored edges
vertex.label = NA,
vertex.color = "lightblue",
main = "(U,W) Graph mixture"
)
This is an example with \(\rho_n = 10/n\) and \(f = \text{star_f1}\). The graph edit function \(\text{star_f1}\) adds stars using a Poisson process.
rho <- function(n) 20/n
gr <- sample_graphette(W,
                       rho_n = rho,
                       graph_edit_f = 'star_f1',
                       n = 200,
                       t_or_p = 2)

plot(gr, vertex.label = NA, vertex.size = 3)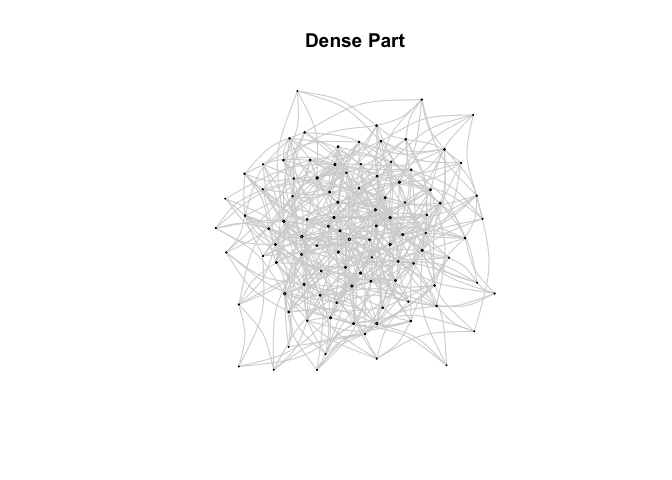
A big thank you to Sashenka Fernando for helping me with the hex sticker.
These binaries (installable software) and packages are in development.
They may not be fully stable and should be used with caution. We make no claims about them.