The hardware and bandwidth for this mirror is donated by METANET, the Webhosting and Full Service-Cloud Provider.
If you wish to report a bug, or if you are interested in having us mirror your free-software or open-source project, please feel free to contact us at mirror[@]metanet.ch.
Predict hatch and emergence timing for wild fish
hatchR is an R package for predicting hatch and emergence timing for a wide range of wild fishes using the effective value framework (Sparks et al., 2019, Canadian Journal of Fisheries and Aquatic Sciences, 76(1): 123-135). hatchR offers users access to established phenological models and the flexibility to incorporate custom parameterizations using external datasets. The package includes functions for model selection, phenology prediction, and visualization. hatchR is designed to be user-friendly and accessible to a wide range of users, including researchers, managers, and educators.
A manuscript accompanying this package is in press at Fisheries, forthcoming this Fall.

Install the released version of hatchR from CRAN:
install.packages("hatchR")Install the latest development version of hatchR from GitHub:
# install.packages("pak")
pak::pak("bmait101/hatchR")You can also use the hatchR Shiny app to interactively predict fish developmental phenology. To run the app, visit the hatchR Shiny app.
We encourage users to report bugs and/or contribute to
hatchR. For more detail on how to do this, please see
our contributing guide (CONTRIBUTING.md).
There are several ways to get help with hatchR:
Below we provide a brief example showing how to use hatchR. For a thorough introduction to the software, see our introductory vignette linked here. For a list of all functions available in hatchR, see our function reference linked here.
First we load hatchR and helper packages by running
library(hatchR)
library(ggplot2)  # for additional plotting options
library(lubridate)  # for working with dates
hatchR requires three primary data inputs:
The example woody_island dataset is included in
hatchR and contains temperature data from Woody Island,
Lake Iliamna, Alaska. It includes daily water temperature data from
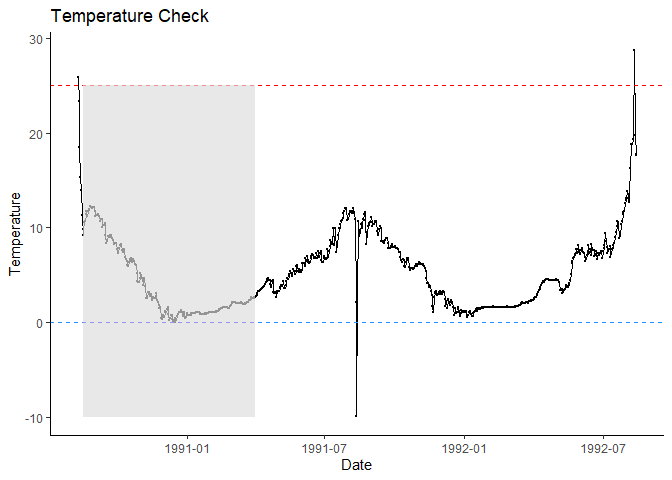
1990-1992. We can use plot_check_temp() to visually check
the data. Spawning in this system typically peaks around August 18 and
hatching and emergence are done before the start of the following
spawning season, so we can predict phenology within a subset of a year.
Because plot_check_temp() returns a
ggplot2 object, we can add additional
ggplot2 elements to customize the plots.
plot_check_temp(
  data = woody_island,
  dates = date,
  temperature = temp_c
  ) +  # additional ggplot2 elements below this `+`
  geom_rect(
    aes(
      xmin = ymd("1990-08-18"),  # spawn date
      xmax = ymd("1991-04-01"),  # approx phenology window end
      ymin = -10,  # lower bound
      ymax = 25),  # upper bound
    fill = "grey",
    alpha = 0.01
) 
Next, select hatch and emerge models we want to use to predict phenology:
sockeye_hatch_mod <- model_select(
  author = "Beacham and Murray 1990",
  species = "sockeye",
  model = 2,
  development_type = "hatch"
  )
Now we can predict phenology for the sockeye salmon using the
predict_phenology() function:
WI_hatch <- predict_phenology(
  data = woody_island,
  dates = date,
  temperature = temp_c,
  spawn.date = "1990-08-18",
  model = sockeye_hatch_mod
  )
We can check the predicted phenology by running:
# see days to hatch
WI_hatch$days_to_develop
#> [1] 74
# and development period
WI_hatch$dev_period
#>        start       stop
#> 1 1990-08-18 1990-10-30
Finally, we can visualize the predicted phenology using
plot_phenology():
plot_phenology(WI_hatch)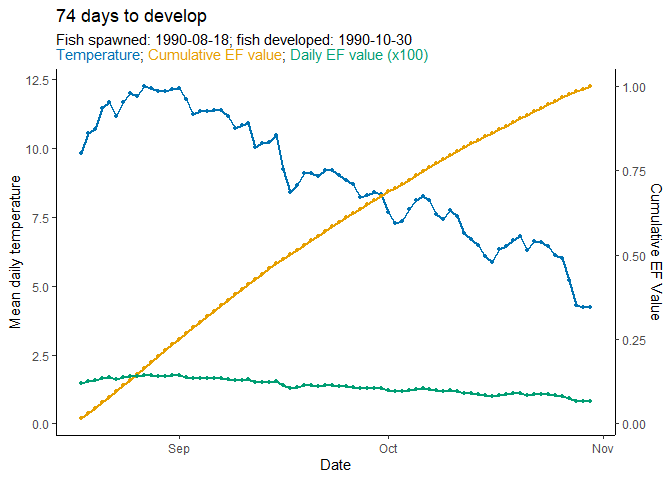
hacthR imports the following R
packages:
.data usage.confint()).hatchR suggests the following R packages:
This project is licensed under the GNU General Public License, GPL-3.
hatchR project code is provided on an “as is” basis and the user assumes responsibility for its use. USDA Forest Service has relinquished control of the information and no longer has responsibility to protect the integrity , confidentiality, or availability of the information. Any reference to specific commercial products, processes, or services by service mark, trademark, manufacturer, or otherwise, does not constitute or imply their endorsement, recommendation or favoring by USDA Forest Service.
These binaries (installable software) and packages are in development.
They may not be fully stable and should be used with caution. We make no claims about them.