The hardware and bandwidth for this mirror is donated by METANET, the Webhosting and Full Service-Cloud Provider.
If you wish to report a bug, or if you are interested in having us mirror your free-software or open-source project, please feel free to contact us at mirror[@]metanet.ch.
This package aims to estimate Nonparametric Cumulative-Incidence Based Estimation of the Ratios of Sub-Hazard Ratios to Cause-Specific Hazard Ratios.
You can install the latest version of hrcomprisk in CRAN
or the development version from Github:
# Install hrcomprisk from CRAN
install.packages("hrcomprisk")
# Or the development version from GitHub:
# install.packages("devtools")
devtools::install_github("AntiportaD/hrcomprisk")hrcomprsk packageYou can use the dataset provided by the authors from the CKiD study, wich has the necessary variables to run the package.
library(hrcomprisk)
data <- hrcomprisk::dat_ckid
dim(data) #dimensions
#> [1] 626  13
names(data) #variable names
#>  [1] "b1nb0"        "event"        "male1fe0"     "incomelt30"   "incomegt75"
#>  [6] "lps"          "foodassist"   "public"       "matedultcoll" "privatemd"
#> [11] "entry"        "exit"         "inckd"
The package will create a data.frame object with the
cumulative incidence of each competing risk for each exposure group. We
can use the CRCumInc fuction.
mydat.CIF<-CRCumInc(df=data, time=exit, event=event, exposed=b1nb0, print.attr=T)
#> $names
#>  [1] "event"       "exposure"    "time"        "CIoinc_comp" "CIxinc_comp"
#>  [6] "CIoinc_1"    "CIxinc_1"    "CIoinc_2"    "CIxinc_2"    "R1"
#> [11] "R2"
#>
#> $class
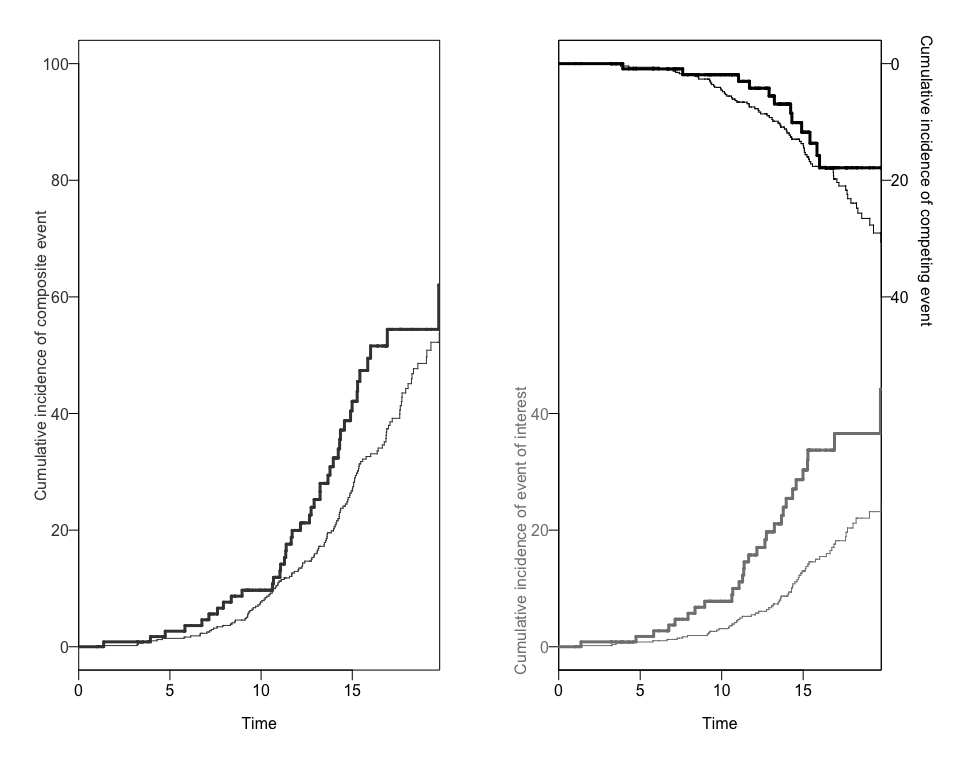
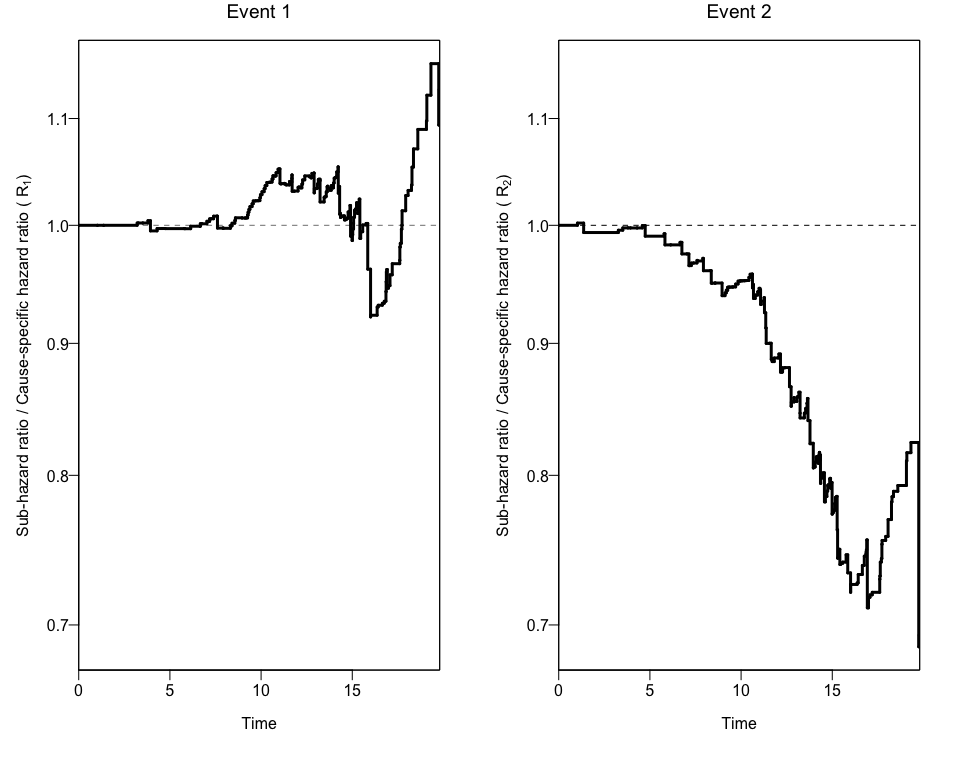
#> [1] "data.frame"We can also obtain two different plots using the plotCIF
function:
plots<-plotCIF(cifobj=mydat.CIF, maxtime = 20, eoi = 1)

In order to get confidence intervals to the ratio of Hazard Ratios
(Rk), we can use the bootCRCumInc function:
ciCIF<-bootCRCumInc(df=data, exit=exit, event=event, exposure=b1nb0, rep=100, print.attr=T)
#> $names
#> [1] "R1.lower" "R1.upper" "R2.lower" "R2.upper"
#>
#> $class
#> [1] "data.frame"
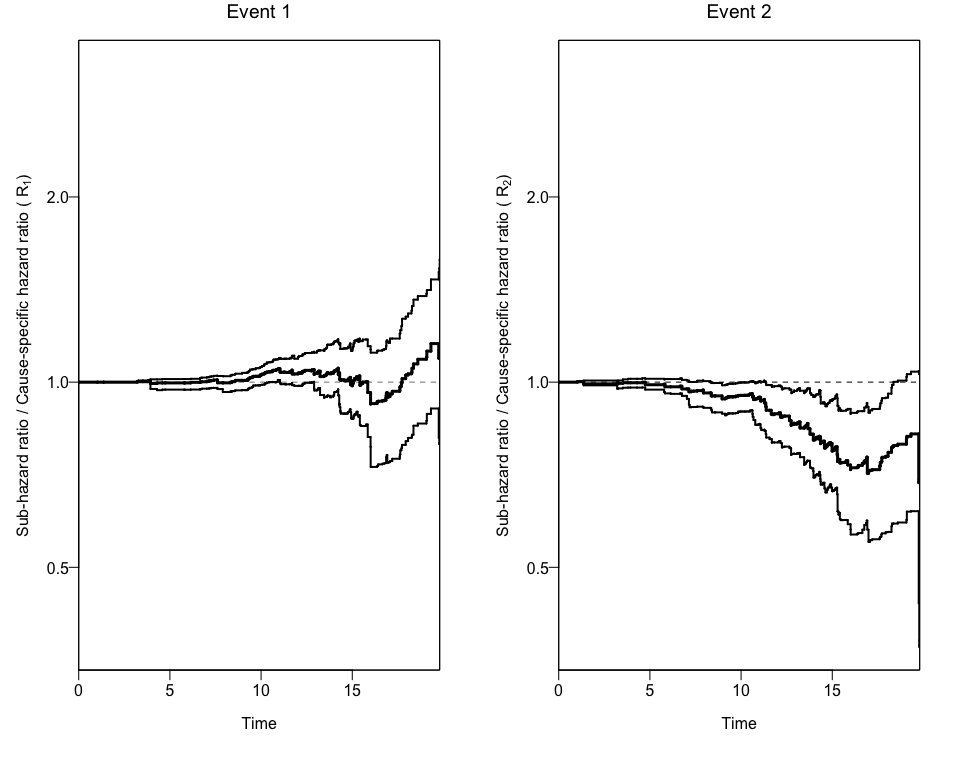
Finally, we can use this new data to add the 95% Confidence Intervals
to the previous plot using again the plotCIF function.
plotCIF(cifobj=mydat.CIF, maxtime= 20, ci=ciCIF)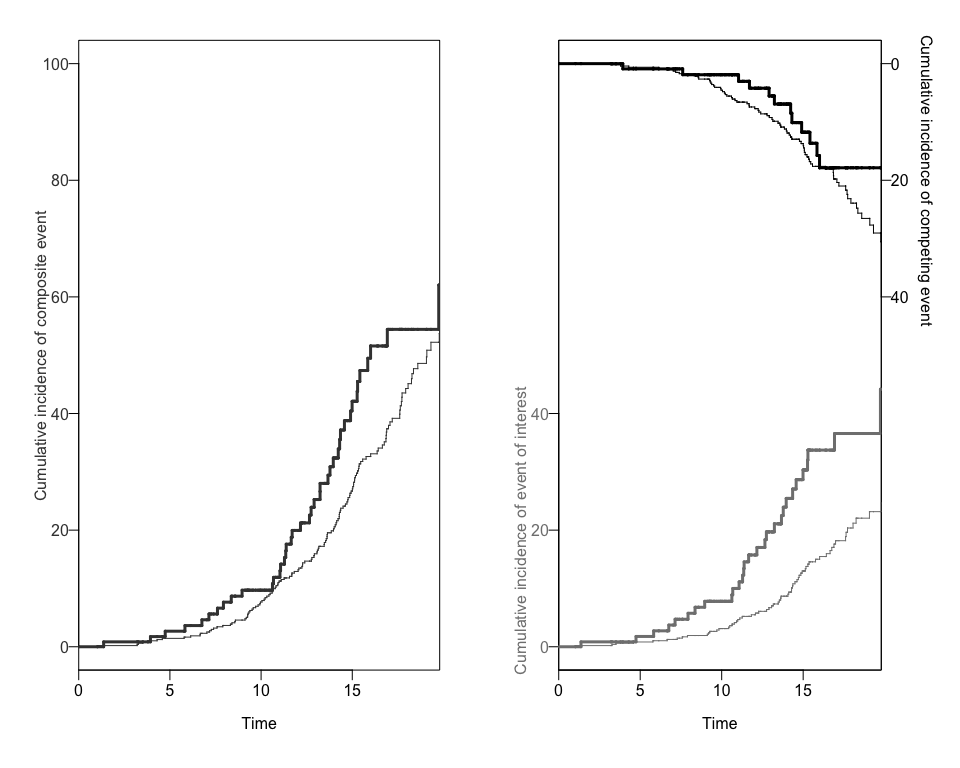
npcrestThe package also offers a wrapper function (npcrest) to
do all these analyses in one step.
npcrest(df=data, exit=exit, event=event, exposure=b1nb0,rep=100, maxtime=20, print.attr=T)
#> $names
#>  [1] "event"       "exposure"    "time"        "CIoinc_comp" "CIxinc_comp"
#>  [6] "CIoinc_1"    "CIxinc_1"    "CIoinc_2"    "CIxinc_2"    "R1"
#> [11] "R2"
#>
#> $class
#> [1] "data.frame"
#>
#> $names
#> [1] "R1.lower" "R1.upper" "R2.lower" "R2.upper"
#>
#> $class
#> [1] "data.frame"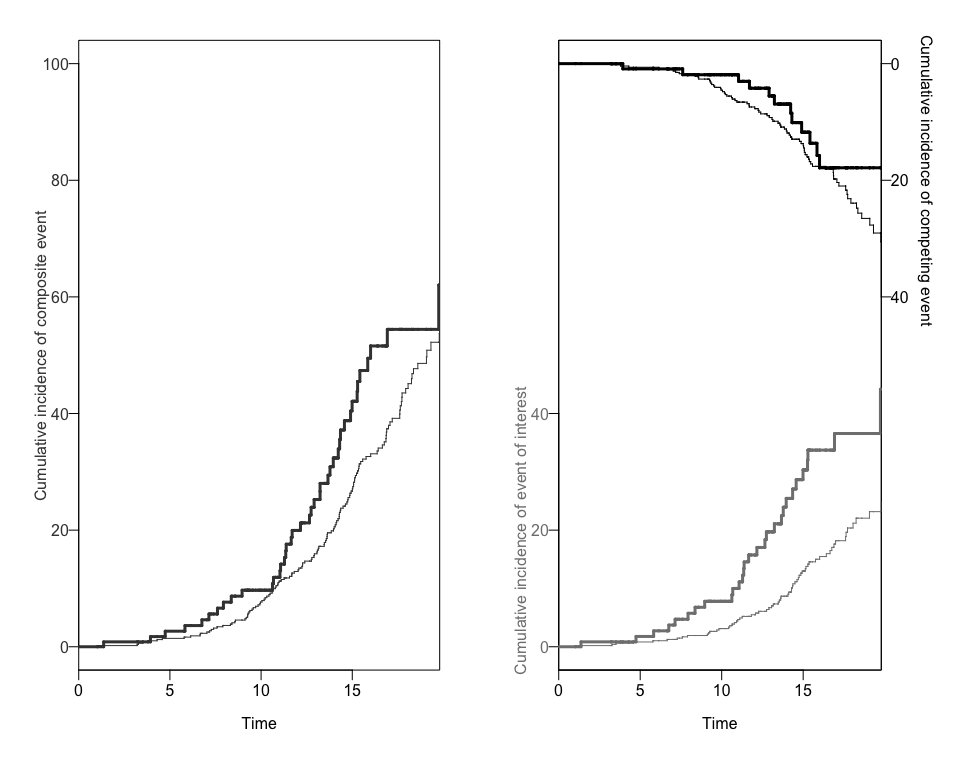
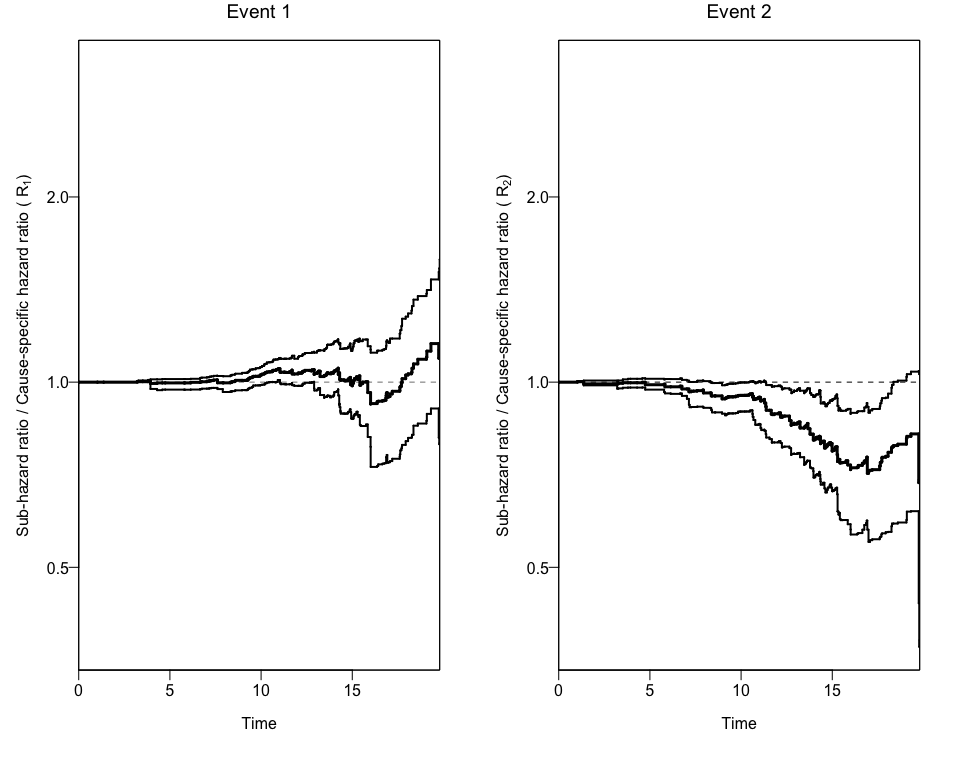
These binaries (installable software) and packages are in development.
They may not be fully stable and should be used with caution. We make no claims about them.