
The hardware and bandwidth for this mirror is donated by METANET, the Webhosting and Full Service-Cloud Provider.
If you wish to report a bug, or if you are interested in having us mirror your free-software or open-source project, please feel free to contact us at mirror[@]metanet.ch.
![]()
![]()
The insee package contains tools to easily download data and metadata from INSEE main database (BDM).
Using embedded SDMX queries, get the data of more than 150 000 INSEE series.
Have a look at the detailed SDMX web service page on insee.fr.
This package is a contribution to reproducible research and public data transparency. It benefits from the developments made by INSEE’s teams working on APIs.
# Get the development version from GitHub
# install.packages("devtools")
# devtools::install_github("pyr-opendatafr/R-Insee-Data")

# Get the CRAN version
install.packages("insee")

# examples below use tidyverse packages
library(tidyverse)
library(insee)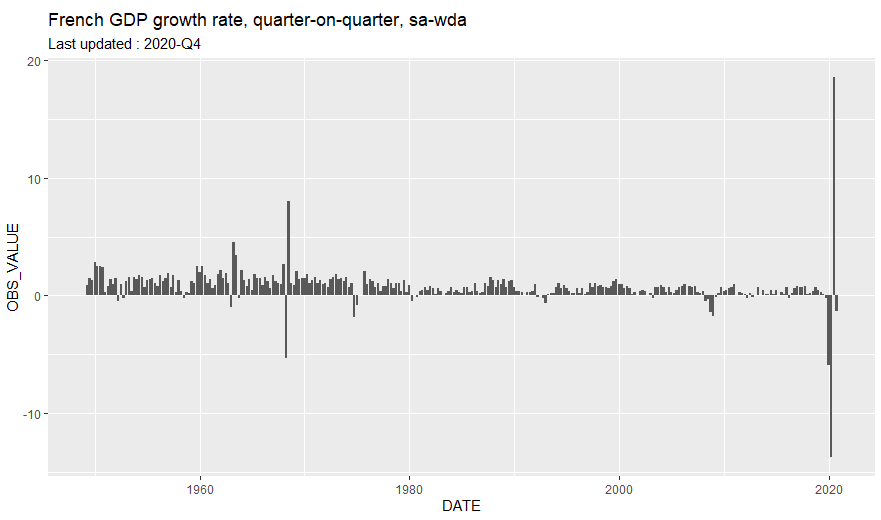
library(tidyverse)
library(insee)

dataset_list = get_dataset_list()

df_idbank_list_selected =
  get_idbank_list("CNT-2014-PIB-EQB-RF") %>% # Gross domestic product balance
  filter(FREQ == "T") %>% #quarter
  add_insee_title() %>% #add titles
  filter(OPERATION == "PIB") %>% #GDP
  filter(NATURE == "TAUX") %>% #rate
  filter(CORRECTION == "CVS-CJO") #SA-WDA, seasonally adjusted, working day adjusted

idbank = df_idbank_list_selected %>% pull(idbank)

data =
  get_insee_idbank(idbank) %>%
  add_insee_metadata()

ggplot(data, aes(x = DATE, y = OBS_VALUE)) +
  geom_col() +
  ggtitle("French GDP growth rate, quarter-on-quarter, sa-wda") +
  labs(subtitle = sprintf("Last updated : %s", data$TIME_PERIOD[1]))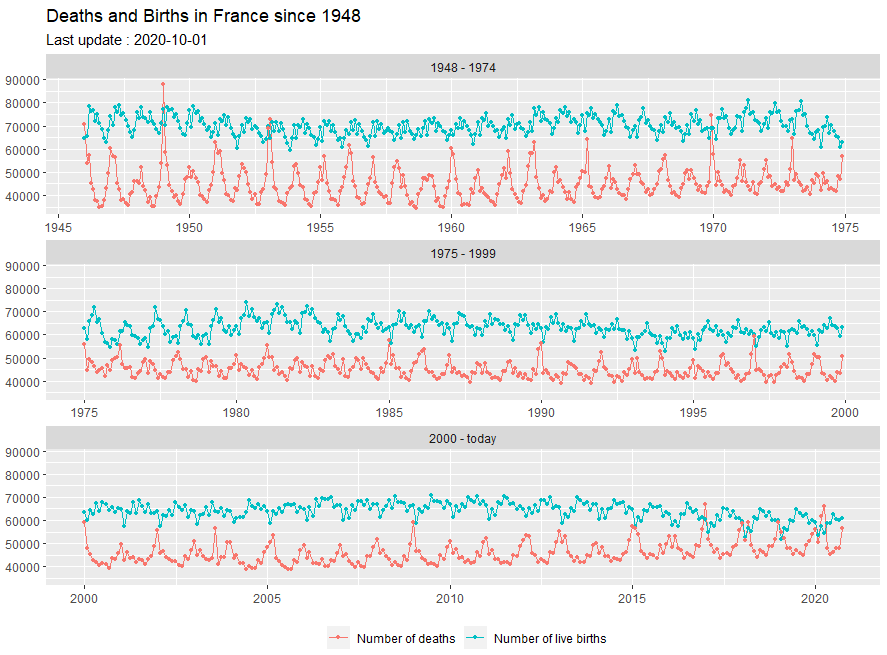
library(insee)
library(tidyverse)

insee_dataset = get_dataset_list()

list_idbank_selected =
  get_idbank_list("DECES-MORTALITE", "NAISSANCES-FECONDITE") %>%
  filter(FREQ == "M") %>% #monthly
  filter(REF_AREA == "FM") %>% #metropolitan territory
  filter(DEMOGRAPHIE %in% c("NAISS", "DECES"))

idbank_selected = list_idbank_selected %>% pull(idbank)

data =
  get_insee_idbank(idbank_selected) %>%
  split_title() %>%
  mutate(period = case_when(DATE < "1975-01-01" ~ "1948 - 1974",
                            DATE >= "1975-01-01" & DATE < "2000-01-01" ~ "1975 - 1999",
                            DATE >= "2000-01-01" ~ "2000 - today"
                            ))

x_dates = seq.Date(from = as.Date("1940-01-01"), to = Sys.Date(), by = "5 years")
last_date = data %>% pull(DATE) %>% max()

ggplot(data, aes(x = DATE, y = OBS_VALUE, colour = TITLE_EN2)) +
  facet_wrap(~period, scales = "free_x", ncol = 1) +
  geom_line() +
  geom_point(size = 0.9) +
  ggtitle("Deaths and Births in France since 1948") +
  labs(subtitle = sprintf("Last update : %s", last_date)) +
  scale_x_date(breaks = x_dates, date_labels = "%Y") +
  theme(
    legend.position = "bottom",
    legend.title = element_blank(),
    axis.title.x = element_blank(),
    axis.title.y = element_blank()
    )
library(insee)
library(tidyverse)
library(raster)
library(rgdal)
library(geosphere)
library(broom)
library(viridis)
library(mapproj)
dataset_list = get_dataset_list()
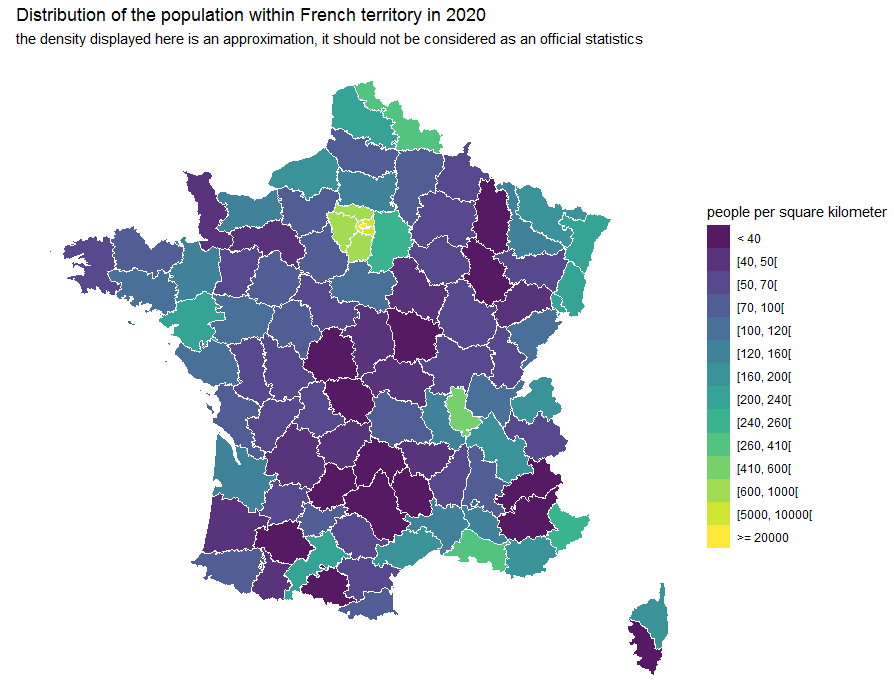
list_idbank =
get_idbank_list("TCRED-ESTIMATIONS-POPULATION") %>%
filter(AGE == "00-") %>% #all ages
filter(SEXE == 0) %>% #men and women
filter(str_detect(REF_AREA, "^D")) %>% #select only departements
add_insee_title()
list_idbank_selected = list_idbank %>% pull(idbank)
# get population data by departement
pop = get_insee_idbank(list_idbank_selected)
#get departements' geographical limits
FranceMap <- raster::getData(name = "GADM", country = "FRA", level = 2)
# extract the population by departement in 2020
pop_plot = pop %>%
group_by(TITLE_EN) %>%
filter(DATE == "2020-01-01") %>%
mutate(dptm = gsub("D", "", REF_AREA)) %>%
filter(dptm %in% FranceMap@data$CC_2) %>%
mutate(dptm = factor(dptm, levels = FranceMap@data$CC_2)) %>%
arrange(dptm) %>%
mutate(id = dptm)
vec_pop = pop_plot %>% pull(OBS_VALUE)
# add population data to the departement object map
FranceMap@data$pop = vec_pop
get_area = function(long, lat){
area = areaPolygon(data.frame(long = long, lat = lat)) / 1000000
return(data.frame(area = area))
}
# extract the departements' limits from the spatial object and compute the surface
FranceMap_tidy_area <-
broom::tidy(FranceMap) %>%
group_by(id) %>%
group_modify(~get_area(long = .x$long, lat = .x$lat))
FranceMap_tidy <-
broom::tidy(FranceMap) %>%
left_join(FranceMap_tidy_area)
# mapping table
dptm_df = data.frame(dptm = FranceMap@data$CC_2,
dptm_name = FranceMap@data$NAME_2,
pop = FranceMap@data$pop,
id = rownames(FranceMap@data))
FranceMap_tidy_final_all =
FranceMap_tidy %>%
left_join(dptm_df, by = "id") %>%
mutate(pop_density = pop/area) %>%
mutate(density_range = case_when(pop_density < 40 ~ "< 40",
pop_density >= 40 & pop_density < 50 ~ "[40, 50]",
pop_density >= 50 & pop_density < 70 ~ "[50, 70]",
pop_density >= 70 & pop_density < 100 ~ "[70, 100]",
pop_density >= 100 & pop_density < 120 ~ "[100, 120]",
pop_density >= 120 & pop_density < 160 ~ "[120, 160]",
pop_density >= 160 & pop_density < 200 ~ "[160, 200]",
pop_density >= 200 & pop_density < 240 ~ "[200, 240]",
pop_density >= 240 & pop_density < 260 ~ "[240, 260]",
pop_density >= 260 & pop_density < 410 ~ "[260, 410]",
pop_density >= 410 & pop_density < 600 ~ "[410, 600]",
pop_density >= 600 & pop_density < 1000 ~ "[600, 1000]",
pop_density >= 1000 & pop_density < 5000 ~ "[1000, 5000]",
pop_density >= 5000 & pop_density < 10000 ~ "[5000, 10000]",
pop_density >= 20000 ~ ">= 20000"
)) %>%
mutate(`people per square kilometer` = factor(density_range,
levels = c("< 40","[40, 50]", "[50, 70]","[70, 100]",
"[100, 120]", "[120, 160]", "[160, 200]",
"[200, 240]", "[240, 260]", "[260, 410]",
"[410, 600]", "[600, 1000]", "[1000, 5000]",
"[5000, 10000]", ">= 20000")))
ggplot(data = FranceMap_tidy_final_all,
aes(fill = `people per square kilometer`, x = long, y = lat, group = group) ,
size = 0, alpha = 0.9) +
geom_polygon() +
geom_path(colour = "white") +
coord_map() +
theme_void() +
scale_fill_viridis(discrete = T) +
ggtitle("Distribution of the population within French territory in 2020") +
labs(subtitle = "the density displayed here is an approximation, it should not be considered as an official statistics")
Sys.setenv(http_proxy = "my_proxy_server")
Sys.setenv(https_proxy = "my_proxy_server")Feel free to open an issue with any question about this package using https://github.com/pyr-opendatafr/R-Insee-Data Github repository
These binaries (installable software) and packages are in development.
They may not be fully stable and should be used with caution. We make no claims about them.