
The hardware and bandwidth for this mirror is donated by METANET, the Webhosting and Full Service-Cloud Provider.
If you wish to report a bug, or if you are interested in having us mirror your free-software or open-source project, please feel free to contact us at mirror[@]metanet.ch.


mcp is regression with multiple change points, inferring
full Bayesian uncertainty for all parameters, including the change
points themselves. At its simplest, it feels like lm() with
one formula per segment. At its most flexible, it aims to be brms
for change points:
GLMM and distributional regression: Gaussian, binomial,
Bernoulli, Poisson, and Negative Binomial families. Group-level (random)
effects, AR/MA, and regression on distributional parameters (e.g.,
sigma, shape).
Express expert knowledge: Specify the number of change
points, the form of each segment, and restrict coefficients via priors.
Compare hypotheses using loo() and
hypothesis().
Native feel: summary(),
plot_pars(), pp_check(), and
as_draws_df() follow the conventions of brms, rstanarm, and posterior,
adapted to change point regression. Inspect the sampled JAGS model in
fit$jags_code.
mcp has 200+
academic citations across ecology, astronomy, neuroscience,
epidemiology, and other disciplines. You will find many aliases for
change point regression in the literature, including piecewise linear,
discontinuity, segmented, and broken stick regression.
Install mcp from CRAN:
install.packages("mcp")or install the development version from GitHub:
if (!requireNamespace("remotes")) install.packages("remotes")
remotes::install_github("lindeloev/mcp@dev")
mcp uses JAGS through rjags. If
installation of rjags reports that JAGS headers or
libraries are missing, install JAGS
4.x and rerun the mcp installation. JAGS 5 is supported
when rjags 5 is released.
mcp takes a list of formulas - one for each segment:
library(mcp)

model = list(
  response ~ 1,  # plateau (Intercept_1)
  ~ 0 + time,    # joined slope (time_2) at cp_1
  ~ 1 + time     # disjoined slope (Intercept_3, time_3) at cp_2
)

data = mcp_example_data("demo")
fit = mcp(model, data)
The change points are the values of the change-point variable (here
time) where the model switches from one formula to the
next. The first formula is just response ~ predictors and
the most common formula for segment 2+ would be
~ predictors (more details here).
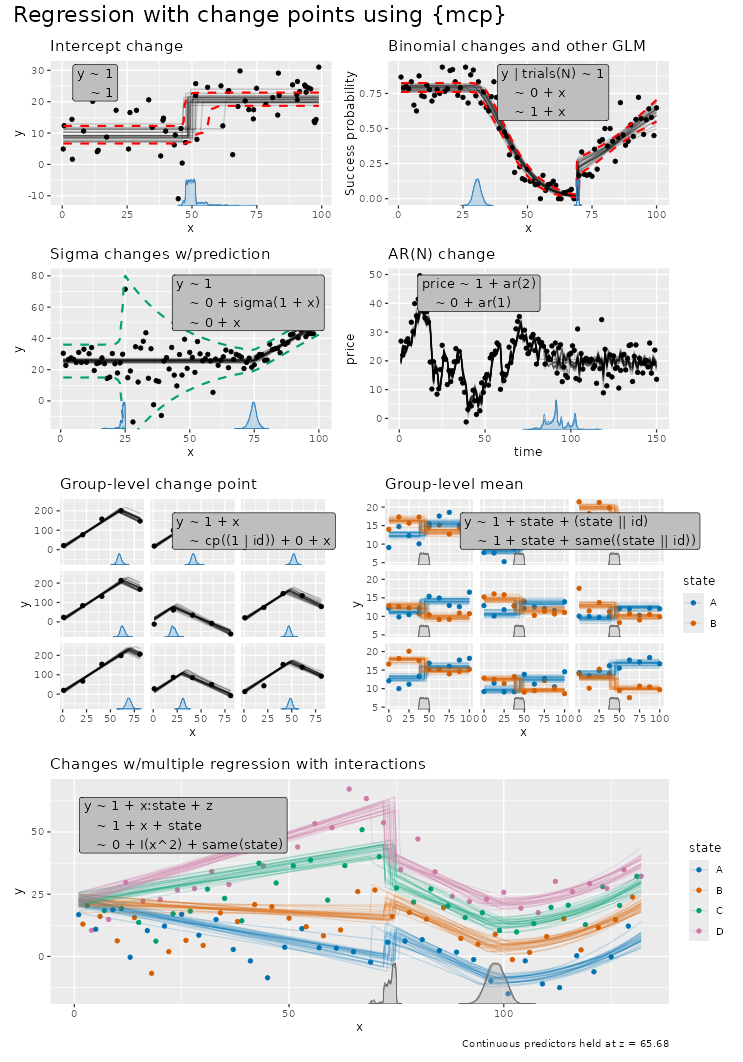
You can do change point regression for a large number of models in a
syntax that aligns with
lm()/glm()/brms. E.g.:
The following model infers the two change points between three segments. You can run this complete worked example (which fits the model and plots by default) in one line:
library(mcp)
demo_fit = mcp_example("demo")  # Also check out other examples
See demo_fit$example_code for how it was generated, and
explore more demos in mcp_example(). But for now, let’s
walk through the example manually:
# Define the model
model = list(
  response ~ 1,  # plateau (Intercept_1)
  ~ 0 + time,    # joined slope (time_2) at cp_1.
  ~ 1 + time     # disjoined slope (Intercept_3, time_3) at cp_2
)

# Get example data and fit it: mcp(model, data, ...)
fit = mcp(model, demo_fit$data, sample = "both")The default plot includes data, fitted lines drawn randomly from the
posterior, and change point(s) posterior density for each chain. Here we
also add the 95% central interval of the fitted values
(interval = "fitted"):
plot(fit, interval = "fitted") + ggtitle("Regression with two change points")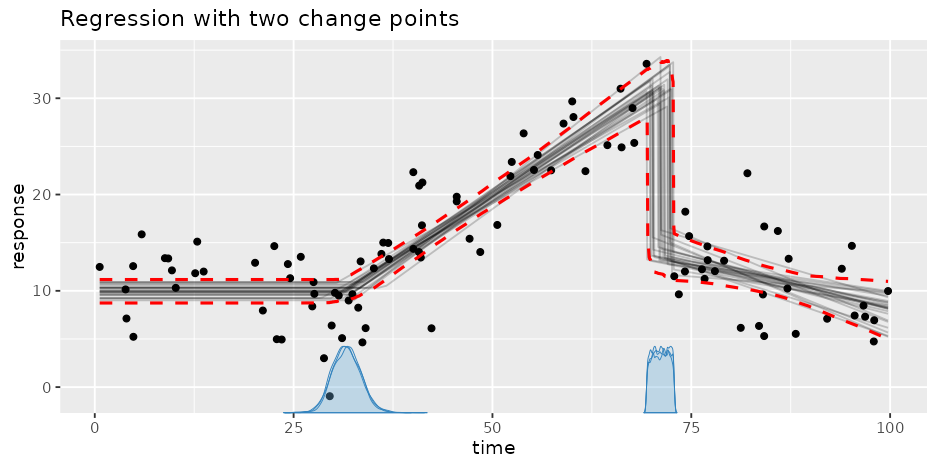
Use summary() to summarise the posterior distribution as
well as sampling diagnostics:
summary(fit)## Family: gaussian
## Links: mu = identity; sigma = identity
## Draws: 9000 (3 chains with iter = 3000)
## Segments:
## 1: response ~ 1
## 2: ~ 0 + time
## 3: ~ 1 + time
##
## Change point parameters:
## parameter mean sd lower upper rhat ess_bulk ess_tail sim match
## cp_1 31.7 1.8 28.4 35.3 1.00 3301 4250 30.0 OK
## cp_2 71.15 0.99 69.47 72.78 1.00 3649 6590 70.00 OK
##
## Population-level parameters:
## parameter mean sd lower upper rhat ess_bulk ess_tail sim match
## Intercept_1 9.94 0.66 8.62 11.22 1.00 4835 6307 10.00 OK
## time_2 0.546 0.047 0.456 0.642 1.00 5165 6622 0.500 OK
## Intercept_3 14.0 1.3 11.4 16.6 1.00 2306 4675 15.0 OK
## time_3 -0.206 0.082 -0.366 -0.045 1.00 1287 2440 -0.300 OK
## sigma_1 3.87 0.28 3.36 4.46 1.00 4455 4623 3.50 OKrhat is the rank-normalized split-Rhat convergence
diagnostic.ess_bulk and ess_tail are the effective
sample sizes for the bulk and tails of the posterior. Warning thresholds
can be changed with
mcp(..., diagnostics = list(rhat = 1.01, ess_bulk = 400, ess_tail = 400));
summary() inherits these settings.mcp (see how in
demo_fit$example_code) so the columns sim and
match show true value and whether it was recovered.plot_pars(fit) can be used to inspect the posteriors and
convergence of all parameters. See the documentation of
plot_pars() for many other plotting options. Here, we plot
just the (population-level) change points. They often have “strange”
posterior distributions, highlighting the need for a computational
approach:
plot_pars(fit, regex_pars = "cp_") + ggtitle("Change point posteriors")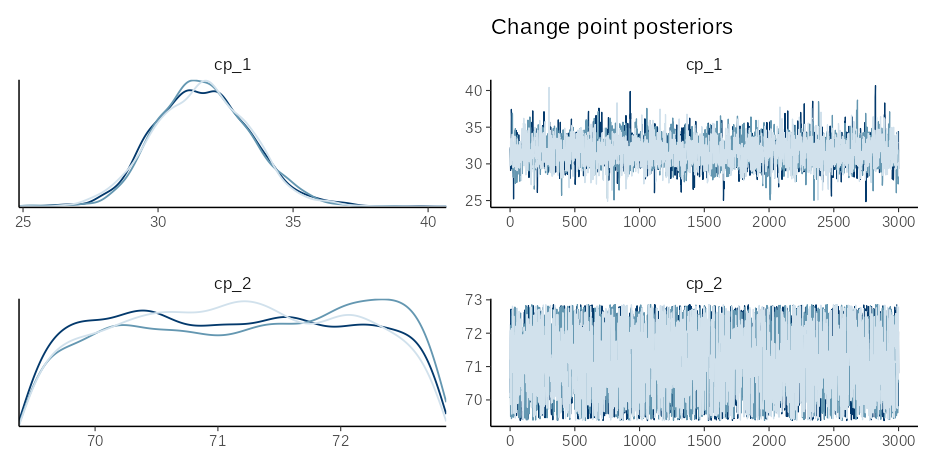
Do a posterior predictive check to see if the model recovers the empirical distribution in the data:
pp_check(fit) + ggtitle("Posterior Predictive check for change point regression")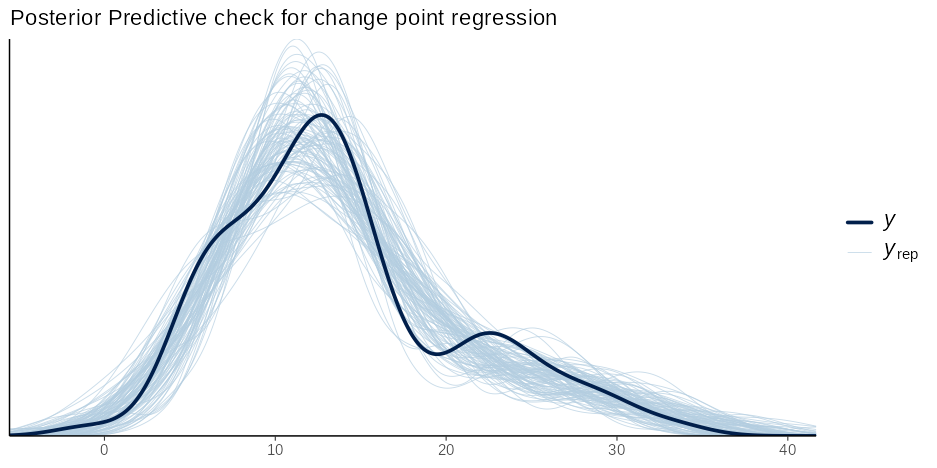
You can expect most generics from R, posterior,
tidybayes to work on mcpfits. E.g., use
fitted(fit) and predict(fit) to get fits and
predictions for in-sample and out-of-sample data, use
as_draws(fit) to get draws (see
?as_draws.mcpfit for all formats), etc.
We can test (joint) probabilities in the model using
hypothesis() (see more
here). For example, what is the evidence (given priors) that the
first change point (cp_1) is later than 30 against it being
earlier than 30?
hypothesis(fit, "cp_1 > 30")## # A tibble: 1 × 7
## hypothesis mean sd lower upper prob BF
## <chr> <dbl> <dbl> <dbl> <dbl> <dbl> <dbl>
## 1 cp_1 - 30 > 0 1.67 1.79 -1.63 5.28 0.826 4.92For model comparisons, we can fit a null model and compare the predictive performance of the two models using (approximate) leave-one-out cross-validation (see more here). Let’s specify a null model where the first two segments are reduced to one straight line, i.e., removing the change point:
# Define the model
model_null = list(response ~ 1 + time)  # Intercept_1 and time_1

# Fit it
fit_null = mcp(model_null, demo_fit$data)
Leveraging the power of loo::loo(), we see that the
two-change-points model is preferred (it is on top), and both
p_worse and the elpd_diff / se_diff ratio
indicate this preference is strong:
fit_loo = loo(fit)
fit_null_loo = loo(fit_null)

loo::loo_compare(fit_loo, fit_null_loo)
## model elpd_diff se_diff p_worse diag_diff diag_elpd
## model1 0.0 0.0 NA
## model2 -58.2 9.0 1.00The articles on the mcp
website go in-depth with the functionality of mcp:
Modeling
~ 0 + x
vs. disjoined ~ 1 + x), parameter names,
same(), and the model math.(1 | id) and cp((1 | id)).sigma(1 + x).ar() and ma()
terms, including change points in autocorrelation.Families
gaussian(),
binomial(), bernoulli(),
poisson(), and negbinomial().offset().Inference
loo(), directional
hypothesis() tests, and Savage-Dickey Bayes factors.fitted() and predict(),
including forecasting with future change points.plot(), plot_dpar(), plot_pars(),
pp_check(), and your own ggplot2 plots.Implementation
mcp writes the JAGS model
in fit$jags_code.This preprint formally introduces
mcp. Find citation info at the link, call
citation("mcp") or copy-paste this into your reference
manager:
  @Article{,
    title = {mcp: An R Package for Regression With Multiple Change Points},
    author = {Jonas Kristoffer Lindeløv},
    journal = {OSF Preprints},
    year = {2020},
    doi = {10.31219/osf.io/fzqxv},
    encoding = {UTF-8},
  }
These binaries (installable software) and packages are in development.
They may not be fully stable and should be used with caution. We make no claims about them.