The hardware and bandwidth for this mirror is donated by METANET, the Webhosting and Full Service-Cloud Provider.
If you wish to report a bug, or if you are interested in having us mirror your free-software or open-source project, please feel free to contact us at mirror[@]metanet.ch.



A layered grammar of graphics for R that is interactive by default, sharp at any resolution, and knows the world map.
orbis builds a plot from a grammar you already recognise, but instead of committing to one output it compiles the plot to a resolution-independent scene description and hands that to two renderers:
Geography is not an add-on. A simplified world polygon dataset ships with the package, and six map projections — including Equal Earth and an orthographic globe — are built in.
# install.packages("remotes")
remotes::install_github("mqfarooqi1/orbis")
orbis imports only base R packages plus htmltools.
library(orbis)

orb(mtcars, x = wt, y = mpg, colour = hp, size = disp) +
  orb_points() +
  orb_labs(title = "Fuel economy", x = "Weight (1000 lbs)",
           y = "Miles per gallon", colour = "Horsepower")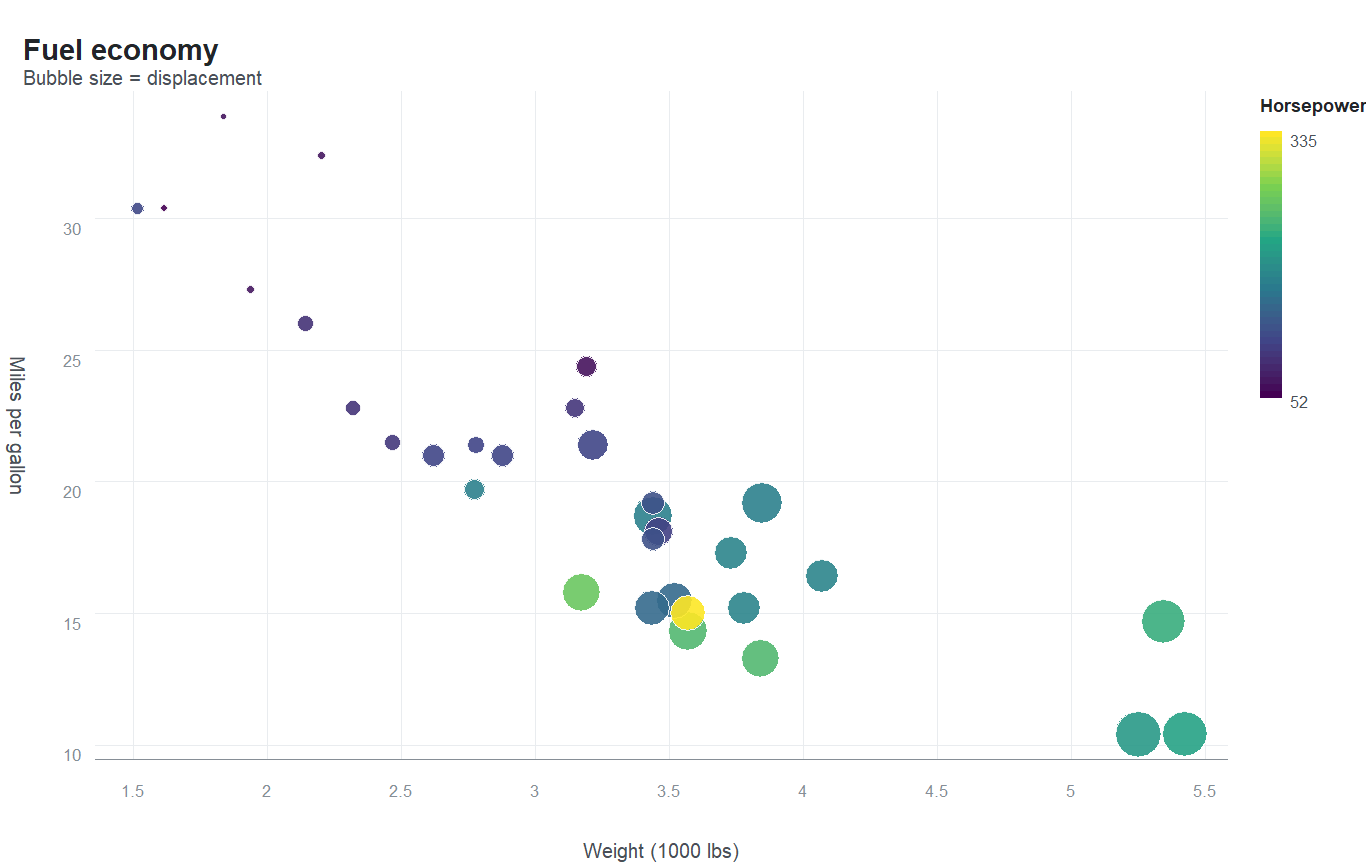
orb_worldmap(values = gdp, value_col = "v", projection = "robinson",
             palette = "mako") +
  orb_labs(title = "World choropleth")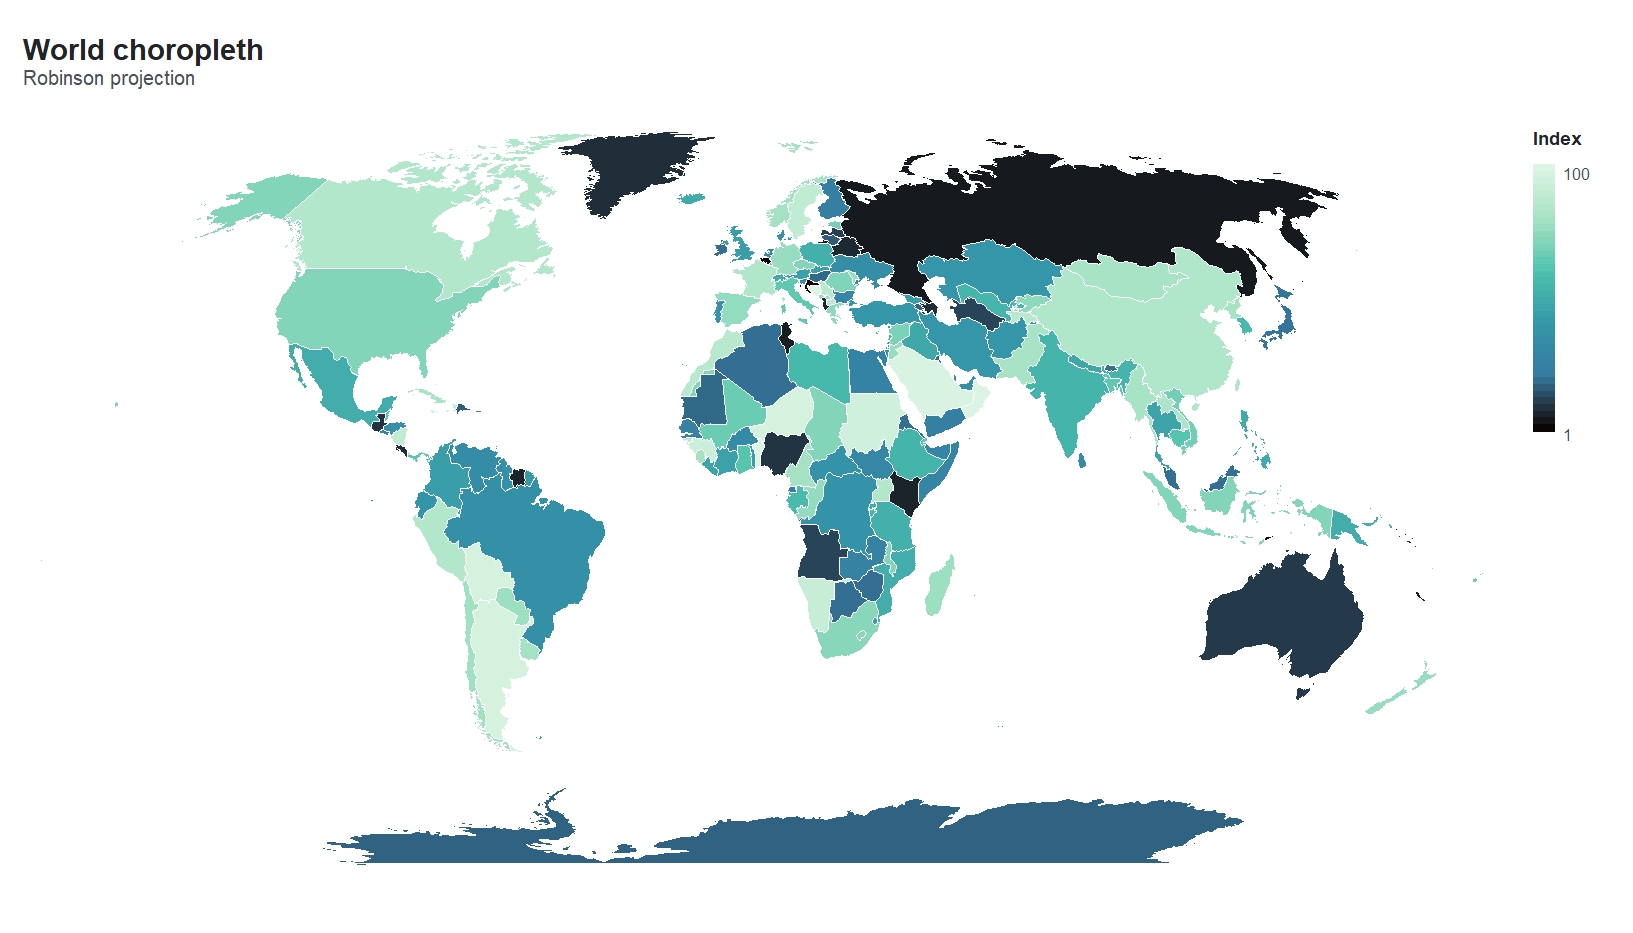
Switch one argument for a globe:
orb_worldmap(values = gdp, value_col = "v", projection = "orthographic",
             palette = "ember", ocean = "#0B1F33") +
  orb_coord_map("orthographic", centre = c(25, 20)) +
  orb_theme_dark()
Projections available: equirectangular,
mercator, robinson, mollweide,
equalearth (the modern equal-area projection of Savric,
Patterson & Jenny) and orthographic. Points can be
placed on any of them with orb_geo_points().
orb(mtcars, x = wt, y = mpg, colour = hp) +
  orb_points() +
  orb_facet(cyl) +
  orb_labs(title = "Small multiples by cylinder count")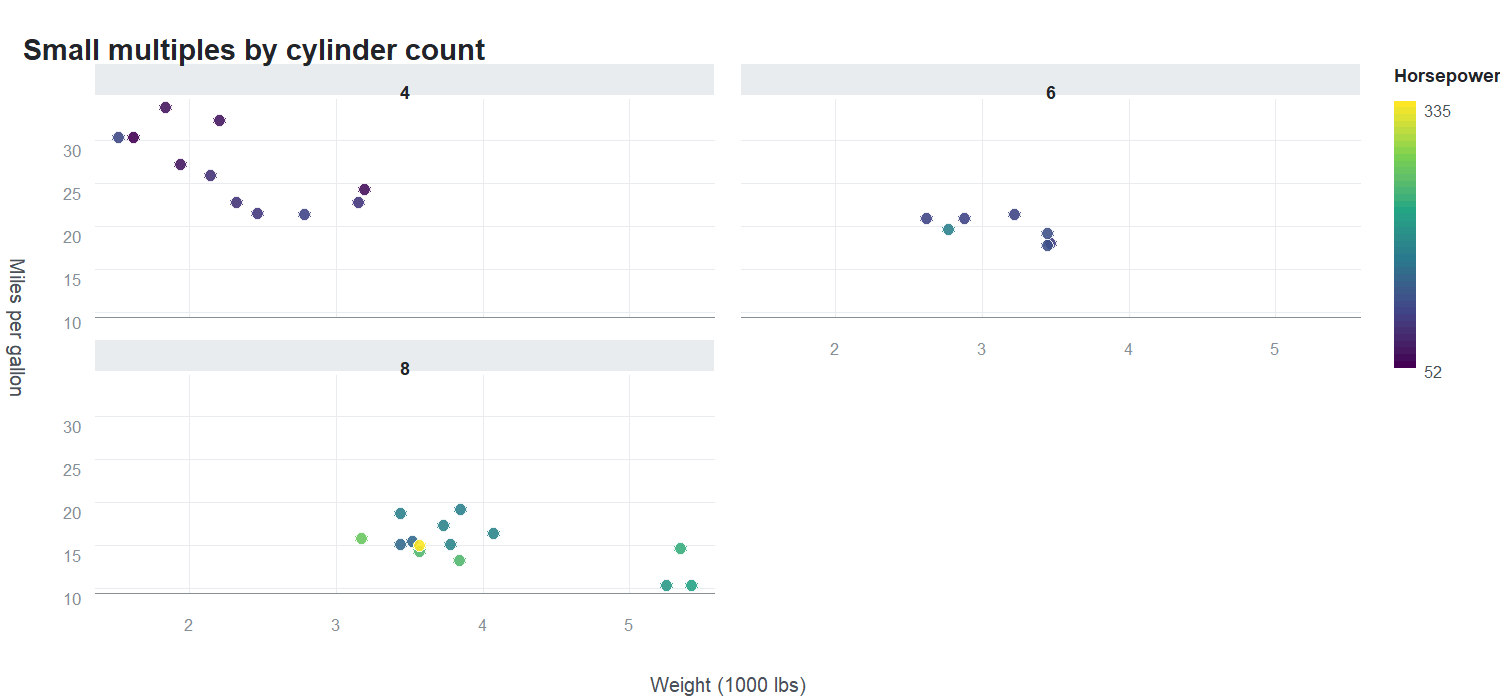
Panels share their scales by default, so they are directly
comparable; pass scales = "free" (or "free_x"
/ "free_y") to let each panel stretch to its own data.
Colours and sizes are always resolved across the whole data set, so a
value means the same thing in every panel.
The same plot object produces both. Nothing is re-specified:
p <- orb(mtcars, x = wt, y = mpg, colour = factor(cyl)) + orb_points()

orb_interactive(p)                  # opens in the viewer: hover, zoom, pan
orb_save(p, "figure.png", dpi = 600) # 600 dpi raster for print
orb_save(p, "figure.pdf")            # vector
orb_save(p, "figure.svg")            # vector, and still interactive
orb_save(p, "figure.html")           # a self-contained interactive page
In the interactive output you can hover for a tooltip, scroll to zoom, drag to pan, double-click to reset, and click a legend key to hide or show that series.
| Function | Purpose |
|---|---|
orb() |
Start a plot: data plus a mapping from variables to channels |
orb_points(), orb_line(),
orb_bars(), orb_area(),
orb_text() |
Layers |
orb_map(), orb_geo_points(),
orb_worldmap() |
Geographic layers |
orb_coord_map() |
Six map projections, including Equal Earth and an orthographic globe |
orb_facet() |
Small multiples: one panel per level, shared or free scales |
orb_scale_colour(), orb_scale_fill(),
orb_scale_size(), orb_scale_x(),
orb_scale_y() |
Scales, limits, log and square-root axes |
orb_theme_light(), orb_theme_dark(),
orb_theme_minimal(), orb_theme_ink() |
Themes |
orb_save(), orb_svg(),
orb_interactive(), orb_draw() |
Output |
orb_palettes() |
Perceptually uniform and qualitative palettes |
world_map |
Simplified world polygons, 229 regions |
orbis is young, and it is not a drop-in replacement for a mature plotting package. In particular:
World boundaries derive from Natural Earth (public domain), via the
maps package.
MIT licensed. Muhammad Farooqi.
These binaries (installable software) and packages are in development.
They may not be fully stable and should be used with caution. We make no claims about them.