The hardware and bandwidth for this mirror is donated by METANET, the Webhosting and Full Service-Cloud Provider.
If you wish to report a bug, or if you are interested in having us mirror your free-software or open-source project, please feel free to contact us at mirror[@]metanet.ch.
The ordgam package enables to fit an additive proportional odds model to ordinal data.
The combination of Laplace approximations and of Bayesian P-splines (named LPS) enable fast and flexible inference in a Bayesian framework. The Gaussian Markov random field prior assumed for the penalized spline parameters and the Bernstein-von Mises theorem typically provide reliable Laplace approximation to the posterior distribution of these quantities. However, this accuracy can be seriously compromised for some unpenalized parameters, especially when the information synthesized by the prior and the likelihood is sparse.
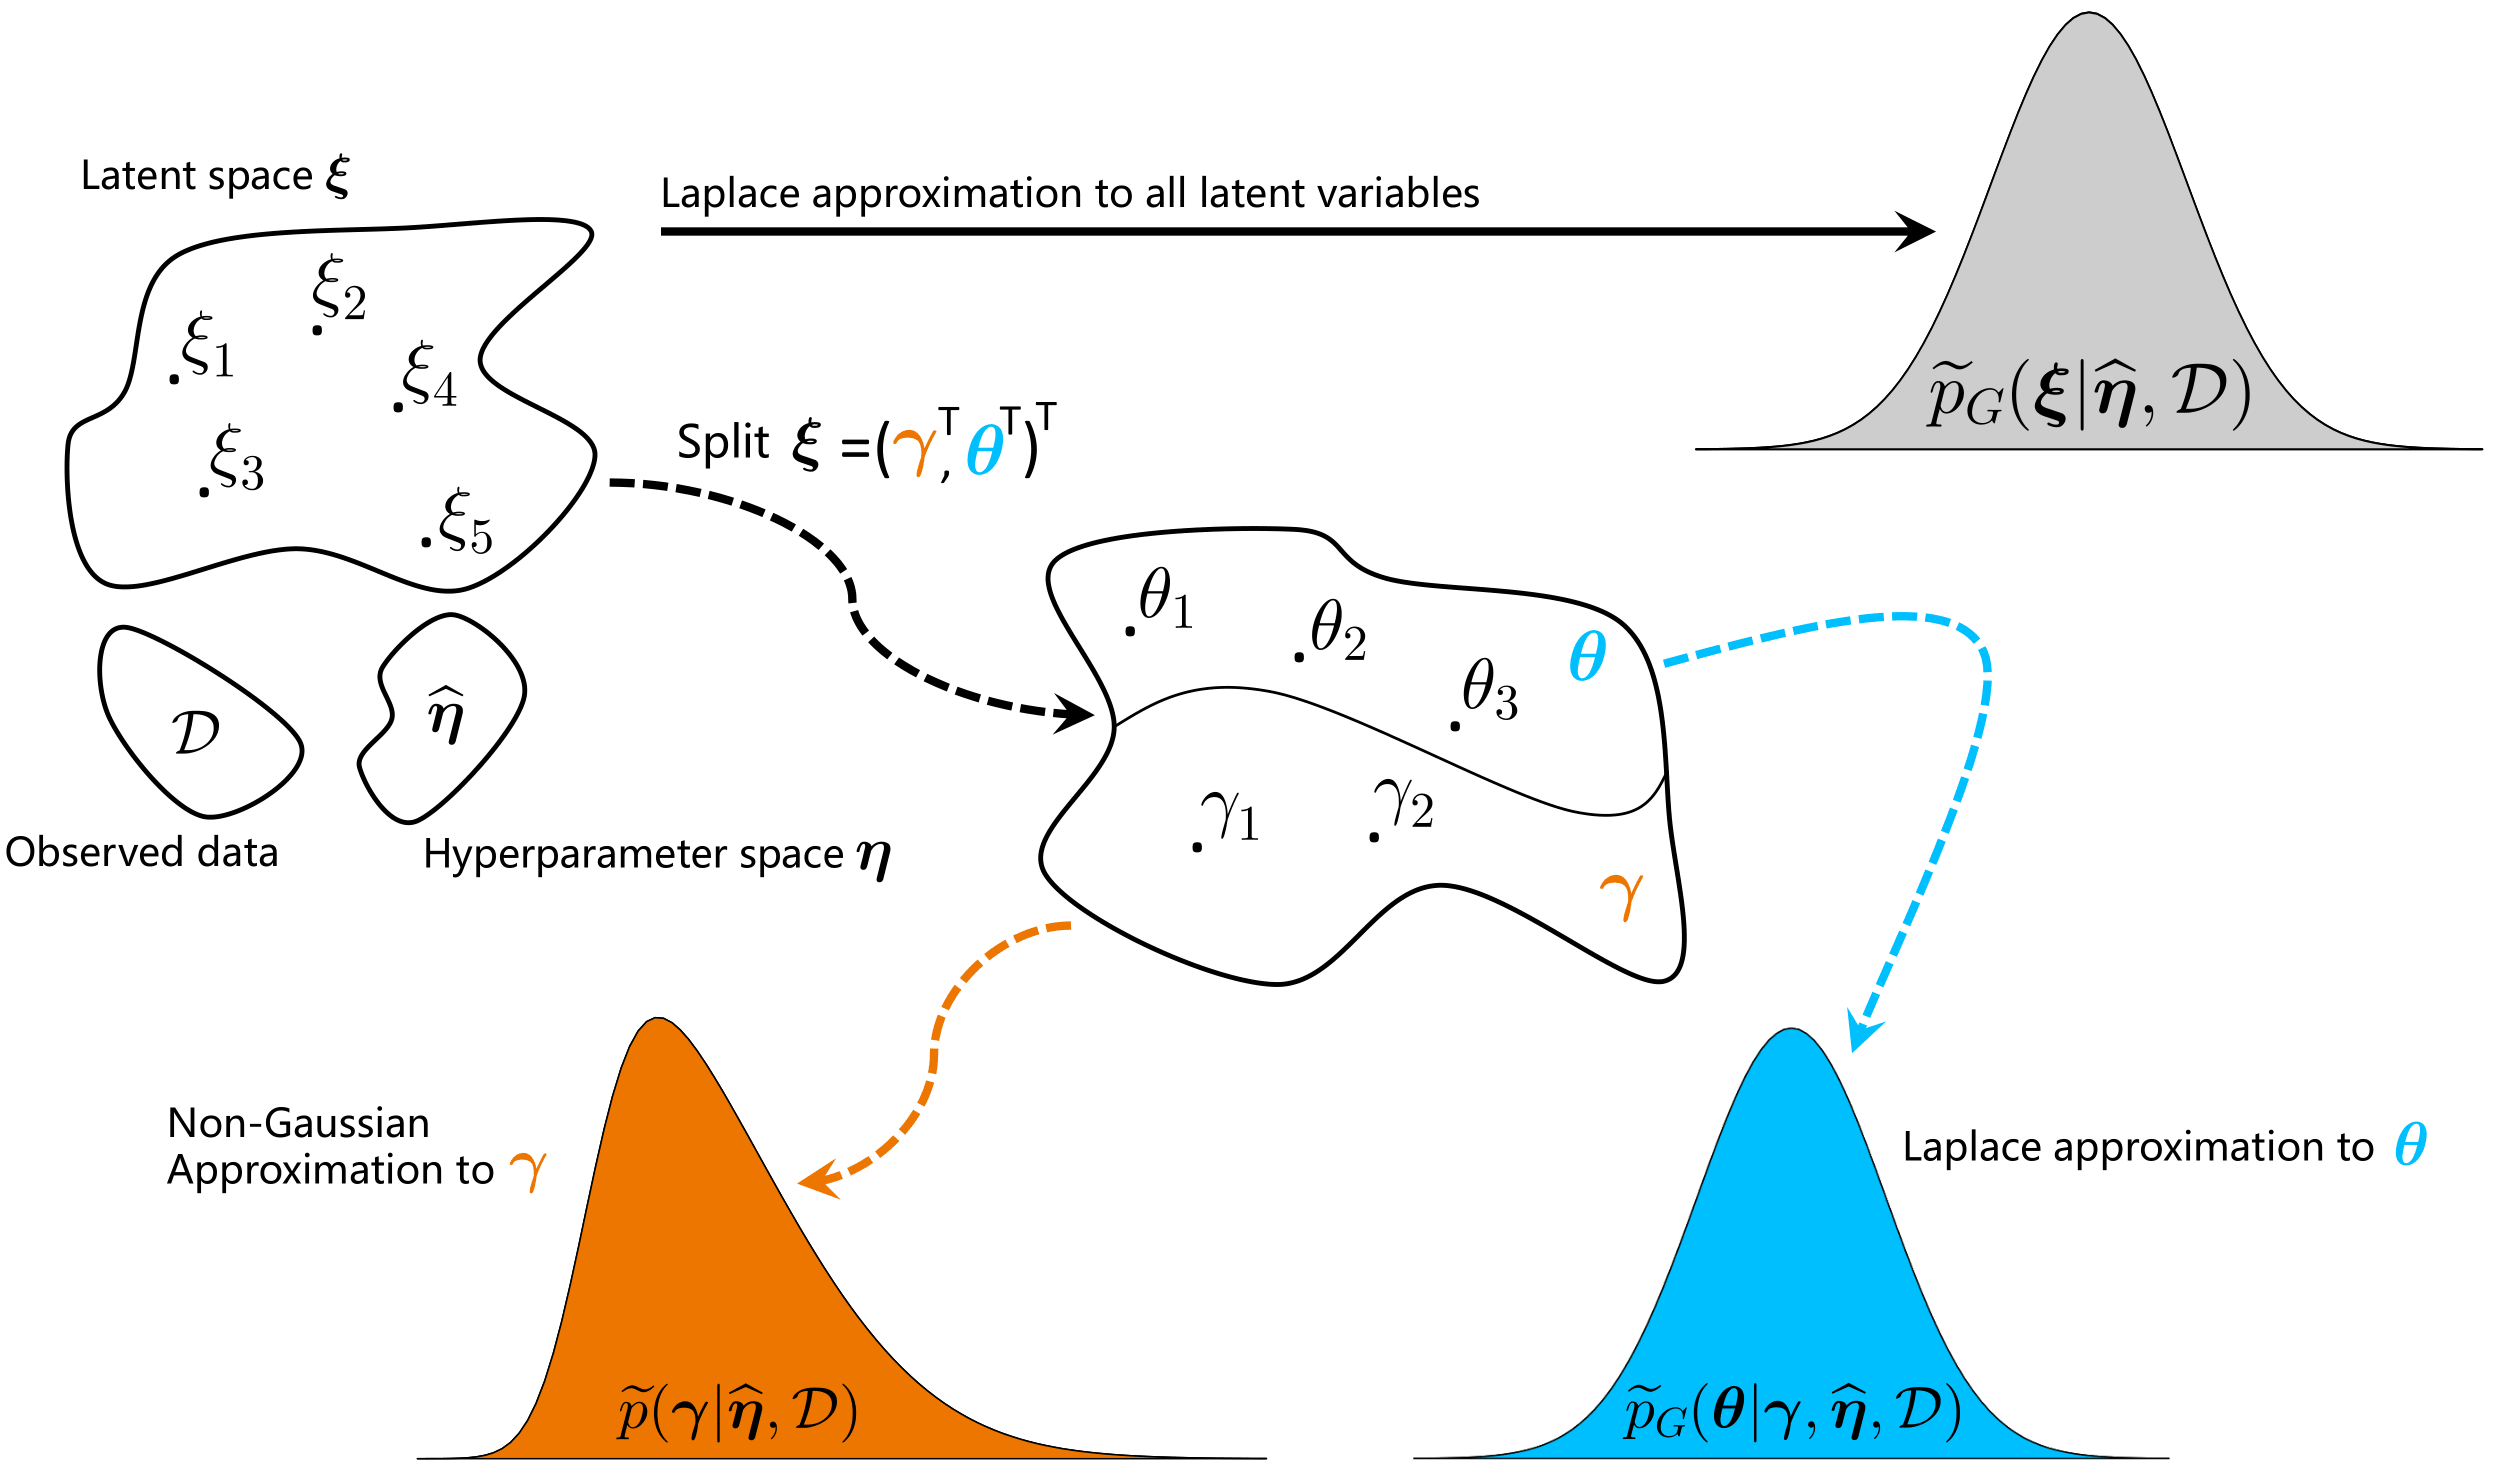
We propose a refined version of the LPS methodology by splitting the parameter space in two subsets, \(\pmb{\zeta}=(\pmb{\gamma}^\top,\pmb{\theta}^\top)^\top\) . The first set involves the non-penalized parameters \(\pmb{\gamma}\) for which the joint posterior distribution \(p(\pmb{\gamma}|\pmb{\lambda},{\cal D})\) is approached from a non-Gaussian perspective with an approximation scheme tailored to capture asymmetry and kurtosis, while the conditional posterior distribution \(p(\pmb{\theta}|\pmb{\gamma},\pmb{\lambda},{\cal D})\) for the penalized parameters \(\pmb{\theta}\) in the complementary set undergoes the LPS treatment with Laplace approximations, see Fig.1 (with \(\pmb{\eta}=\pmb{\lambda}\)).
The marginal posterior density \(p(\pmb{\nu}|{\cal D})\) for the log of the penalty parameters, \(\pmb{\nu}=\log(\pmb{\lambda})\), also could be approximated using a product of skew-t densities. More details can be found in Lambert & Gressani (2023) [1].

Let us illustrate the use of the ordgam package on a data subset (\(n=552\)) from the European Social Survey (ESS 2018) specific to the French speaking respondents from Wallonia, one of the three regions in Belgium. Each of the participants (aged at least 15) was asked to react to the following statement, Gay men and lesbians should be free to live their own life as they wish, with a positioning on a Likert scale going from 1 (Agree strongly) to 5 (Disagree strongly).
## Package installation and loading
## install.packages("devtools")
## devtools::install_github("plambertULiege/ordgam")
library(ordgam)

## Data reading
data(freehmsDataBE)
donnees = subset(freehmsDataBE,region=="WAL") ## Focus on Wallonia
head(donnees)
## freehms gndr age eduyrs region
## 2 1 Male 25 17 WAL
## 3 2 Female 76 6 WAL
## 7 1 Male 69 17 WAL
## 9 2 Male 36 10 WAL
## 12 1 Male 54 7 WAL
## 18 1 Female 28 14 WALLet us fit a proportional odds model to these data with the number of completed years of education (\(14.1\pm 4.4\) years) and age (\(47.3\pm 18.5\) years) entering as additive terms, \(L=10\) recentered B-splines spanning each covariate range, and Gamma priors for the penalty parameters, \(\lambda_j\sim{\cal G}(1,10^{-4})\) (\(j=1,2\)).
## Model fit with a Gamma prior for the penalty parameters
mod = ordgam(freehms ~ s(eduyrs) + s(age), data=donnees, descending = FALSE)
print(mod)
## Call:
## ordgam(formula = freehms ~ s(eduyrs) + s(age), data = donnees, descending = FALSE)
##
## Prior set on the regression paramaters <beta>
##
## Parameter estimation:
## est se low up Z Pval
## 1 0.0272 0.1152 -0.1986 0.2530 0.24 0.81
## 2 1.6318 0.1400 1.3574 1.9062 11.66 <2e-16 ***
## 3 2.5509 0.1863 2.1858 2.9160 13.69 <2e-16 ***
## 4 4.4168 0.4163 3.6008 5.2328 10.61 <2e-16 ***
##
## Approximate significance of smooth terms:
## edf Tr Pval Chi2 Pval
## f(eduyrs) 1.24 1.01 0.477617 1.15 0.35501
## f(age) 2.55 18.77 0.000265 18.82 0.00017 ***
##
## Selected penalty parameters <lambda>: 191.7967 18.40125
## Lambda log prior: dgamma(lambda, 1, 1e-04, log = TRUE)
##
## Likelihood - Information criterions (n = 552):
## edf logL logLmarg AIC BIC
## 7.79 -598.66 -606.75 1212.90 1246.49
##
## NOTE: model the odds of a response value in the lower scaleThe estimated additive terms can also be visualized:
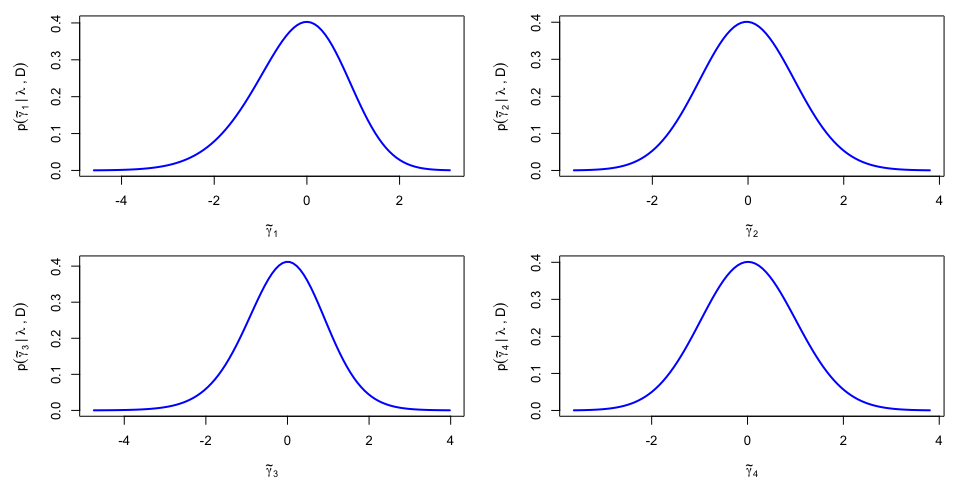
plot(mod, mfrow=c(1,2))The asymmetry of the posterior for the non-penalized parameters \(\pmb{\gamma}\) can be visualized. The first step in the approach requires the projection of \(\pmb{\gamma}\) on the eigenvectors of the variance-covariance matrix \(\Sigma_\lambda^{\gamma\gamma}\), yielding \(\tilde{\pmb{\gamma}}\) and its approximately independent components. The posterior density \(p(\tilde\gamma_k|\lambda,{\cal D})\) is further approximated using a skew-t density, revealing a non-negligible asymmetry for the posterior of \(\tilde\gamma_1\) (corresponding to the direction of the eigenvector with the largest eigenvalue):
model = mod  ## Model for which the approximation is required

## Skew-t approximation to the marginal of gamma.tilde[k]
ngamma = with(model, nalpha+nfixed)  ## Number of non-penalized parms
gamt.ST = list()  ## Skew-t coefs --> dst(x,dp=coef)
for (k in 1:ngamma){ ## Loop over the gamma.tilde components
     x.grid = seq(-4,4,length=10)  ## Grid of values for gamma.tilde[k]
     lfy.grid = ordgam::lmarg.gammaTilde(x.grid,k=k,model)  ## log p(gamma.tilde[k] | D)
     gamt.ST[[k]] = ordgam:::STapprox(x.grid,lfy.grid)$dp  ## Approximate using a skew-t
}

## Visualization of the posterior for <gamma.tilde[k]>
par(mfrow=c(2,2),mar=c(4,5,1,1))
for (k in 1:ngamma){ ## Loop over the gamma.tilde components
     xlab = bquote(tilde(gamma)[.(k)])
     ylab = bquote(p(tilde(gamma)[.(k)]~ "|"~lambda~","~D))
     xlim = sn::qst(c(.0001,.9999),dp=gamt.ST[[k]])
     curve(sn::dst(x,dp=gamt.ST[[k]]), xlim=xlim,
           xlab=xlab,ylab=ylab,col="blue",lwd=2,lty=1)
}
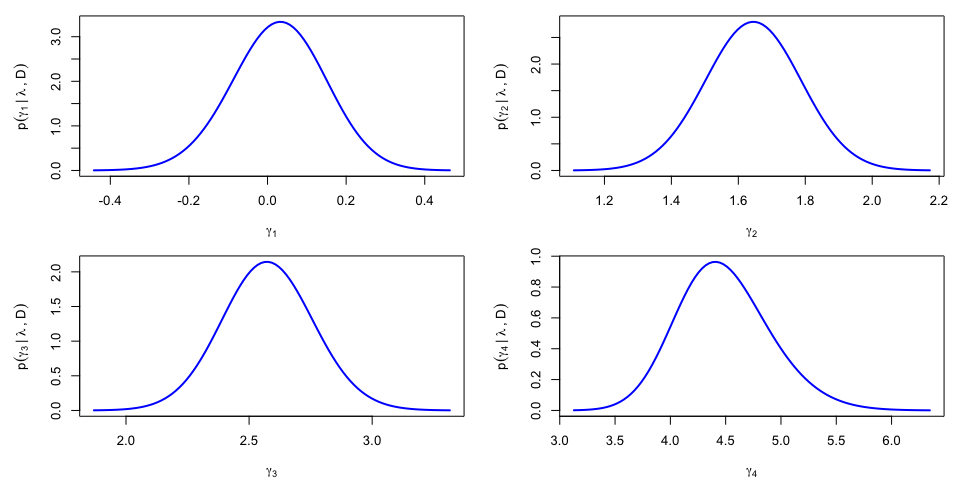
The results can be re-expressed in the original parametrization, yieding \(p(\gamma_k|\lambda,{\cal D})\) and a noticable asymmetry for the posterior density of \(\gamma_4\):
## Sampling <gamma.tilde> using the (approximate) independence of its components
M = 10000
sample.tilde = matrix(nrow=M,ncol=ngamma)
for (k in 1:ngamma){
    ## ... or using skew-t approximation
    sample.tilde[,k] = c(sn::rst(M, dp=gamt.ST[[k]]))
}

## Revert sample to the original <gamma> parametrization
gam.hat = model$theta[1:ngamma]  ## MAP estimate
Sig = model$Sigma.theta[1:ngamma,1:ngamma] ## Variance-covariance
sv = svd(Sig) ; V = sv$u ; omega = sv$d  ## SVD
sample.gam = t(gam.hat + V %*% (sqrt(omega) * t(sample.tilde)))

## Skew-t approximation to the marginal of gam[k]
gam.ST = gam.ST2 = list()
for (k in 1:ngamma){
    temp = hist(sample.gam[,k],plot=FALSE)
    gam.ST[[k]] = ordgam:::STapprox(temp$mids,log(temp$density+1e-6))$dp
    ## temp = selm(sample.gam[,k] ~ 1, family="ST")
    ## gam.ST2[[k]] = coef(temp,"DP")
}

## Visualize p(gamma[k] | lambda,data)
par(mfrow=c(2,2),mar=c(4,5,1,1))
for (k in 1:ngamma){
    xlab = bquote(gamma[.(k)])
    ylab = bquote(p(gamma[.(k)]~ "|"~lambda~","~D))
    xlim = sn::qst(c(.0001,.9999),dp=gam.ST[[k]])
    curve(sn::dst(x,dp=gam.ST[[k]]), lwd=2,col="blue",
          xlim=xlim, xlab=xlab, ylab=ylab)
}
Let us revisit the same model for the data collected in Flanders, the most populated region of Belgium.
## Model fit with a Gamma prior for the penalty parameters
mod.FL = ordgam(freehms ~ s(eduyrs) + s(age), data=subset(freehmsDataBE,region=="FL"),
                descending = FALSE)
print(mod.FL)
## Call:
## ordgam(formula = freehms ~ s(eduyrs) + s(age), descending = FALSE,
## data = subset(freehmsDataBE, region == "FL"))
##
## Prior set on the regression paramaters <beta>
##
## Parameter estimation:
## est se low up Z Pval
## 1 0.3176 0.0866 0.1479 0.4872 3.67 0.00024 ***
## 2 2.7105 0.1367 2.4426 2.9784 19.83 < 2e-16 ***
## 3 3.4898 0.1829 3.1312 3.8484 19.08 < 2e-16 ***
## 4 4.8852 0.3407 4.2174 5.5530 14.34 < 2e-16 ***
##
## Approximate significance of smooth terms:
## edf Tr Pval Chi2 Pval
## f(eduyrs) 1.15 27.7 9.64e-07 29.0 1.0e-07 ***
## f(age) 2.57 34.6 1.41e-06 34.6 7.9e-08 ***
##
## Selected penalty parameters <lambda>: 296.6694 33.87409
## Lambda log prior: dgamma(lambda, 1, 1e-04, log = TRUE)
##
## Likelihood - Information criterions (n = 1046):
## edf logL logLmarg AIC BIC
## 7.72 -923.13 -932.09 1861.70 1899.94
##
## NOTE: model the odds of a response value in the lower scalefhat.FL = plot(mod.FL, mfrow=c(1,2))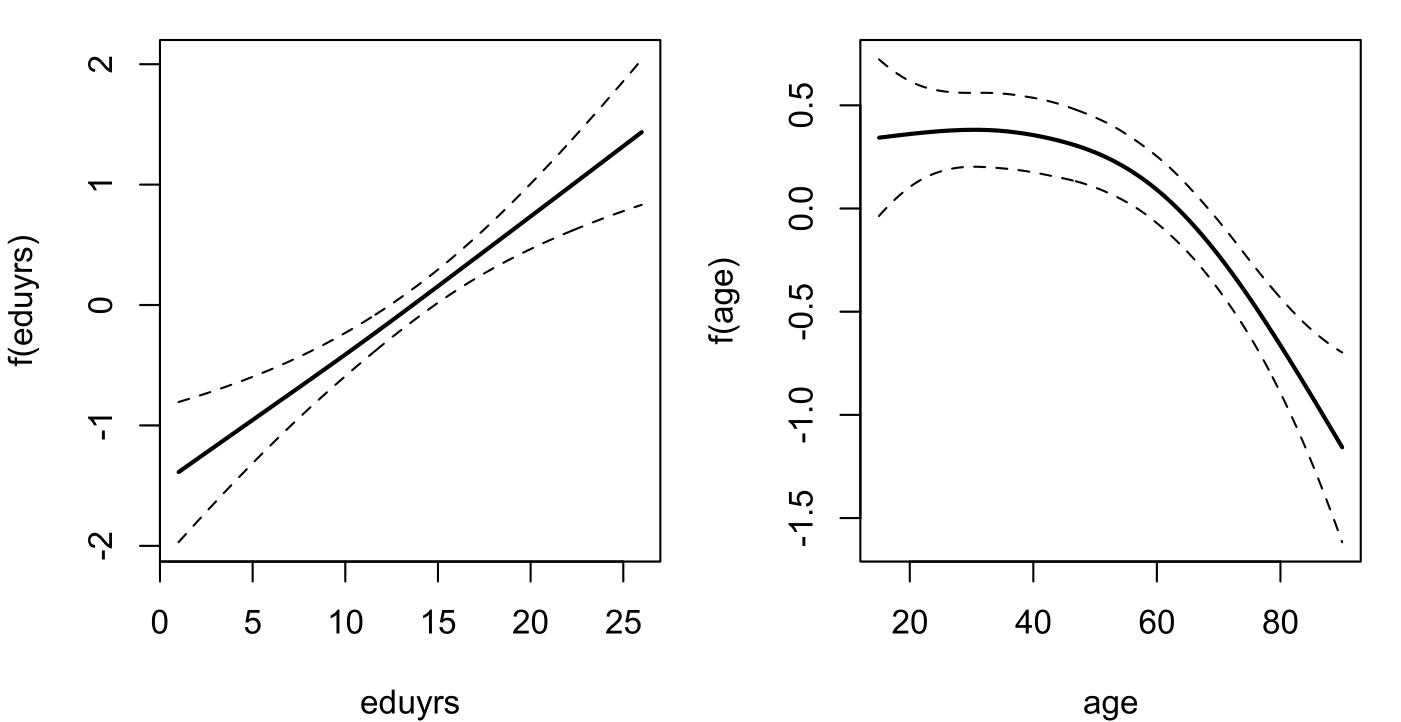
The estimated additive terms for education and age look a bit different from the estimates for Wallonia with, here, the suggestion of a statistically significant and linear effect of ‘eduyrs’.
The marginal posterior distribution of the log of the penalty parameters, \(\nu_j=\log\lambda_j\), can be visualized and compared to the their prior:
model = mod.FL
## log(lambda) marginal posteriors
par(mfrow=c(1,2),mar=c(4,5,3,1))
for (j in 1:2){ ## Loop over <nu> components
  ## Plot of the approximating skew-t to the marginal posterior of <nu[j]>
  xlims = sn::qst(c(.001,.999),dp=model$nu.dp[[j]])
  xlab = bquote(log(lambda[.(j)]))
  ylab = bquote(p(log(lambda[.(j)])~ "|"~D))
  curve(sn::dst(x,dp=model$nu.dp[[j]]),xlims[1],xlims[2],lwd=2,col="red",
        main=names(model$lambda)[j],xlab=xlab,ylab=ylab,ylim=c(0,.4))
  ## ... compared to the prior for <nu[j]>
  curve(exp(model$lprior.lambda(exp(x)))*exp(x),add=T,lty=3,lwd=2)
  legend("topright", legend=c("Posterior","Prior"),
         lwd=c(2,2), lty=c(1,3), col=c("red","black"),
         horiz=TRUE, bty="n",cex=1)
}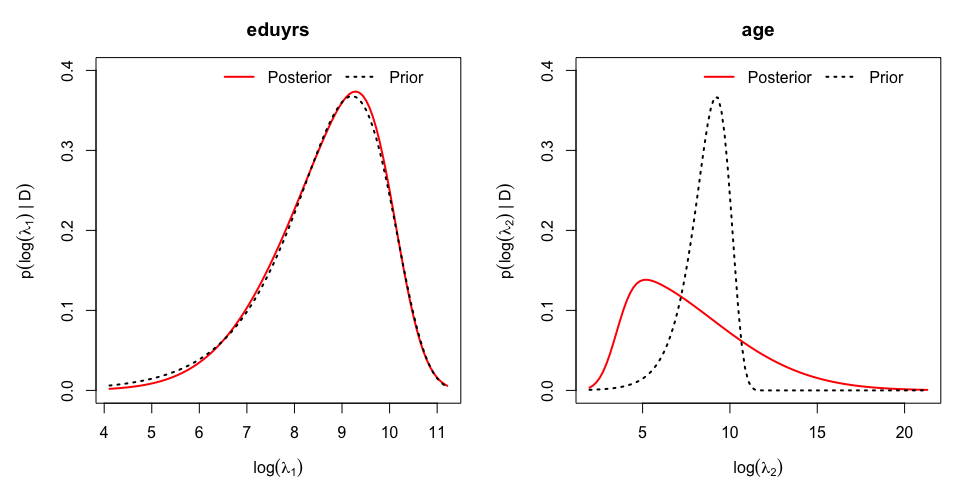
While the first posterior associated to penalty parameter for ‘eduyrs’ does not depart from its prior with a large prior mean (as \(\lambda_1 \sim {\cal G}(1,10^{-4})\) has prior mean \(10^4\)) and suggests linearity, the posterior associated to \(\nu_2=\log(\lambda_2)\) suggests a non-linear effect of ‘age’ by pointing to smaller values for the penalty parameter.
ordgam: Additive proportional odds model for ordinal data using Laplace approximations and Bayesian P-splines. Copyright (C) 2022-2023 Philippe Lambert
This program is free software: you can redistribute it and/or modify it under the terms of the GNU General Public License as published by the Free Software Foundation, either version 3 of the License, or (at your option) any later version.
This program is distributed in the hope that it will be useful, but WITHOUT ANY WARRANTY; without even the implied warranty of MERCHANTABILITY or FITNESS FOR A PARTICULAR PURPOSE. See the GNU General Public License for more details.
You should have received a copy of the GNU General Public License along with this program. If not, see https://www.gnu.org/licenses/.
[1] Lambert, P. and Gressani, O (2023). Penalty parameter selection and asymmetry corrections to Laplace approximations in Bayesian P-splines models. Statistical Modelling doi:10.1177/1471082X231181173. Preprint: arXiv:2210.01668
[2] Lambert, P. (2023) R-package ordgam - CRAN and GitHub: plambertULiege/ordgam
These binaries (installable software) and packages are in development.
They may not be fully stable and should be used with caution. We make no claims about them.