The hardware and bandwidth for this mirror is donated by METANET, the Webhosting and Full Service-Cloud Provider.
If you wish to report a bug, or if you are interested in having us mirror your free-software or open-source project, please feel free to contact us at mirror[@]metanet.ch.
phyloTop provides tools for calculating and viewing topological properties of phylogenetic trees.
To install the development version from github:
library(devtools)
install_github("michellekendall/phyloTop")
The stable version can be installed from CRAN using:
install.packages("phyloTop")Then, to load the package, use:
library("phyloTop")

## Loading required package: apeThe key functions available in phyloTop are:
avgLadder: find the average ladder
size in a tree
cherries: find the number of
cherries in a tree
colless.phylo: find the Colless
imbalance number of a tree
getDepths: find the depth of each
node in a tree
ILnumber: find the number of nodes
with exactly one tip child
ladderSizes: find the size of any
“ladders” in a tree (consecutive nodes, each with exactly one tip
child)
maxHeight: find the maximum height
(equivalently, depth) of nodes in a tree
nConfig: find the sizes of all
configurations (equivalently, clades) in a tree
nodeDepth: find the depth of a
given node in a tree
nodeDepthFrac: find the fraction of
nodes in a tree at a given depth
nodeImb: find the imbalance of a
given node in a tree
nodeImbFrac: find the fraction of
nodes in a tree with an imbalance of a given threshold or more
phyloTop: find a range of tree
statistics for a list of trees (faster than calling each function
individually)
pitchforks: find the number of
pitchforks (clades of size three) in a tree
sackin.phylo: find the Sackin index
of a tree
splitTop: find the split topology
of a tree - the size of clades at a given depth
stairs: find the “staircase-ness”
measures, as defined by Norstrom et al. 2012
treeImb: find the tree imbalance -
the imbalance at each node
widths: find the number of nodes at
each depth in a tree
configShow: plot a tree,
highlighting the configurations of a given size
ladderShow: plot a tree,
highlighting the “ladders”
subtreeShow: plot a tree,
highlighting the subtree(s) descending from the given node(s)
makeEpiRecord: simulate an
epidemiological record of infectors, infectees, infection times and
recovery times
getLabGenealogy: create a genealogy
from an epidemiological record
Apply tree statistic functions to a list of 10 random trees, each with 50 tips:
set.seed(123)
phyloTop(rmtree(10,50))

##    avgLadder cherries colless.phylo ILnumber maxHeight pitchforks sackin.phylo
## 1      0.000       19            82       12         9          9          312
## 2      2.167       16           120       18         9          7          330
## 3      2.500       19           192       12        12          6          394
## 4      2.333       16           139       18        11          9          345
## 5      2.000       18           150       14        10          8          358
## 6      2.333       17           105       16        11         10          321
## 7      2.333       19           112       12        10          5          330
## 8      2.333       15           229       20        13          9          421
## 9      3.000       17           121       16        11          7          331
## 10     3.000       16           181       18        12          7          377
##    stairs1 stairs2
## 1   0.5510  0.7257
## 2   0.5306  0.6752
## 3   0.5102  0.6907
## 4   0.6327  0.6487
## 5   0.5714  0.6880
## 6   0.6122  0.6649
## 7   0.5714  0.6696
## 8   0.6735  0.5760
## 9   0.6122  0.6487
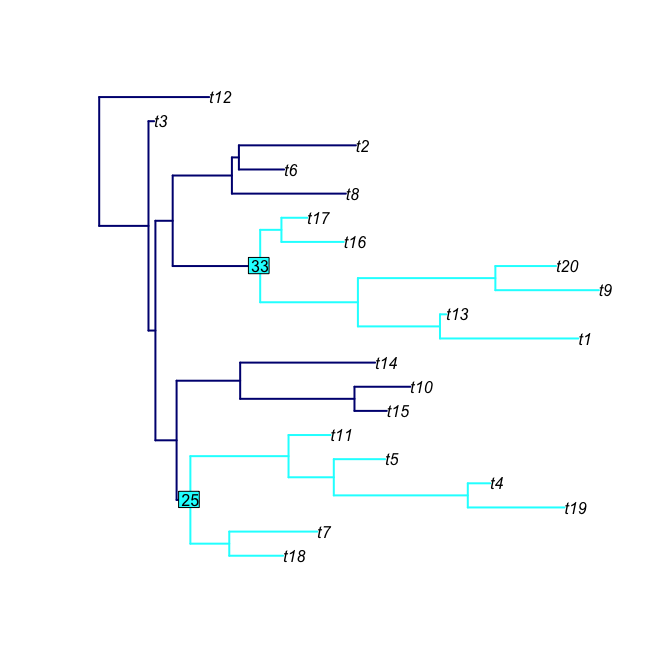
## 10 0.6122 0.6237Plot a random tree with 20 tips, highlighting the the clade(s) descending from nodes 25 and 33:
subtreeShow(rtree(20),nodeList=c(25,33), mainCol="navy", subtreeCol="cyan", nodeLabelCol="cyan", edge.width=2)
Contributions are welcome via pull requests.
Please note that this project is released with a Contributor Code of Conduct. By participating in this project you agree to abide by its terms.
Questions, feature requests and bugs can be reported using the package’s issue system.
These binaries (installable software) and packages are in development.
They may not be fully stable and should be used with caution. We make no claims about them.