The hardware and bandwidth for this mirror is donated by METANET, the Webhosting and Full Service-Cloud Provider.
If you wish to report a bug, or if you are interested in having us mirror your free-software or open-source project, please feel free to contact us at mirror[@]metanet.ch.
plotthis is an R package that is built upon
ggplot2 and other plotting packages. It provides high-level
APIs and a wide range of options to create stunning, publication-quality
plots effortlessly.
install.packages("plotthis")
# or to install the latest version:
remotes::install_github("pwwang/plotthis")
devtools::install_github("pwwang/plotthis")
You can also install the package using conda:
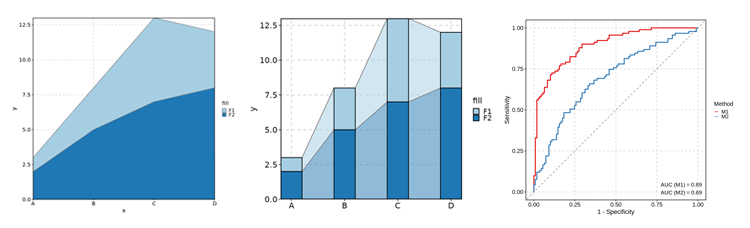
$ conda install pwwang::r-plotthisAreaPlot
/ TrendPlot
/ ROCCurve
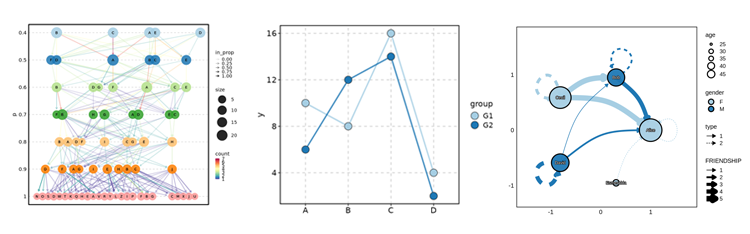
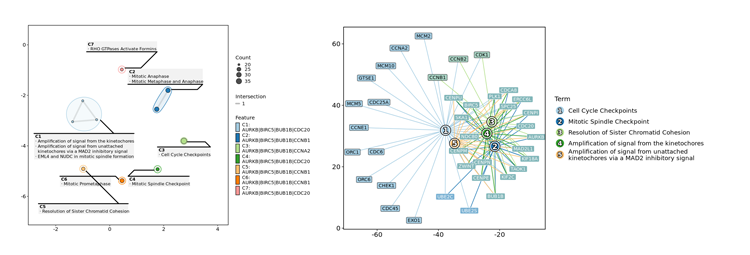
ClustreePlot
/ LinePlot
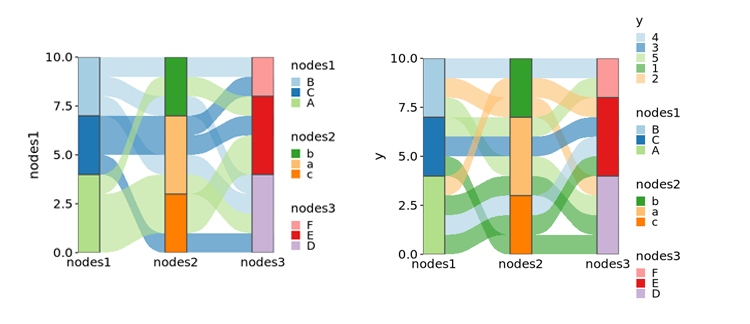
/ Network
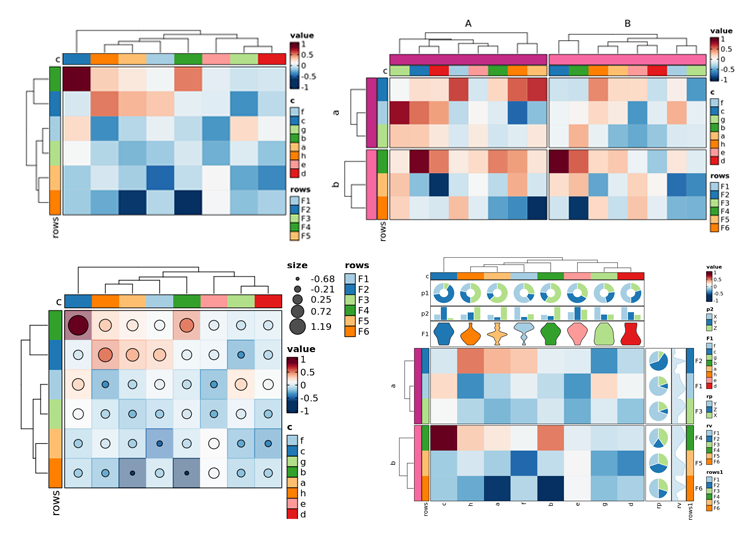
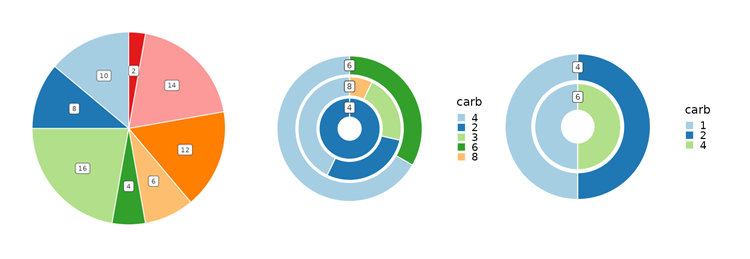
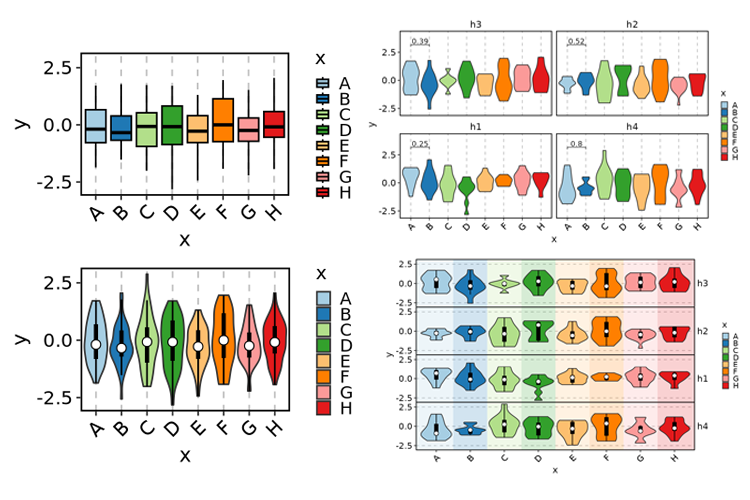
BoxPlot
/ ViolinPlot
/ BeeswarmPlot
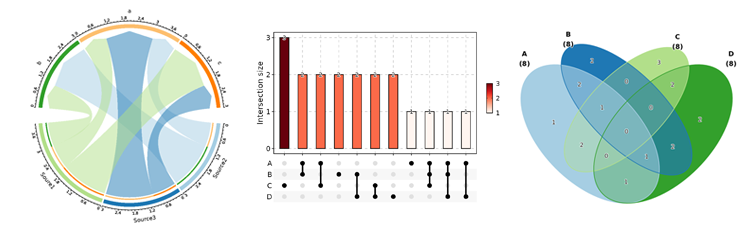
ChordPlot
/ UpsetPlot
/ VennDiagram
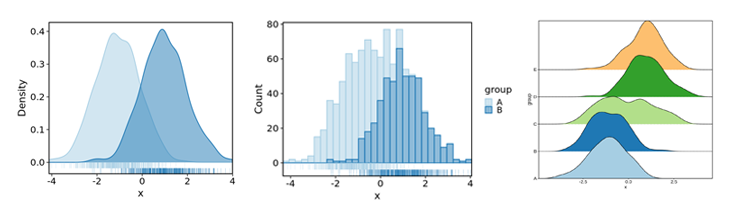
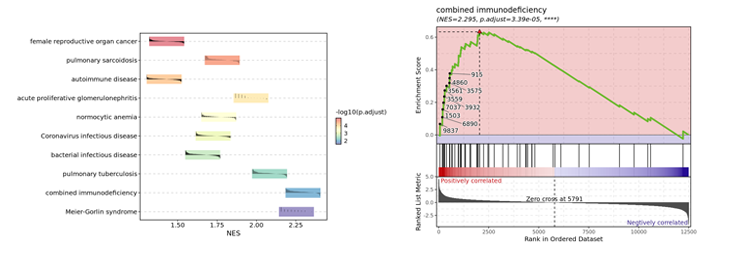
DensityPlot
/ Histogram
/ RidgePlot
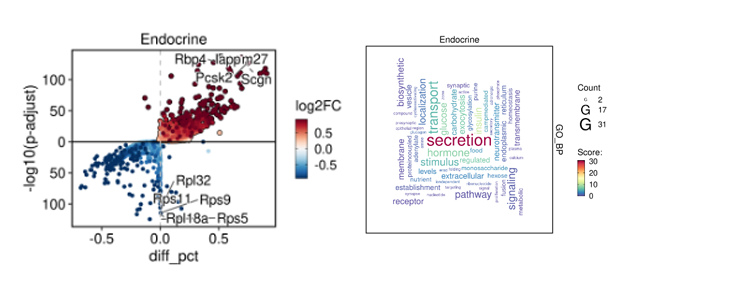
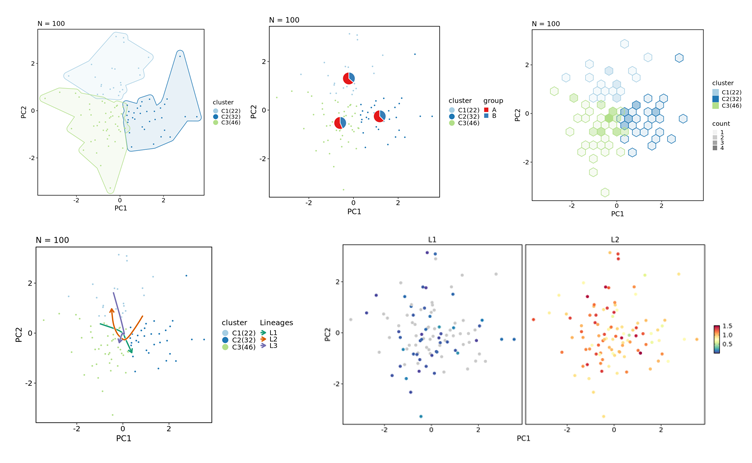
DimPlot
/ FeatureDimPlot
/ VelocityPlot
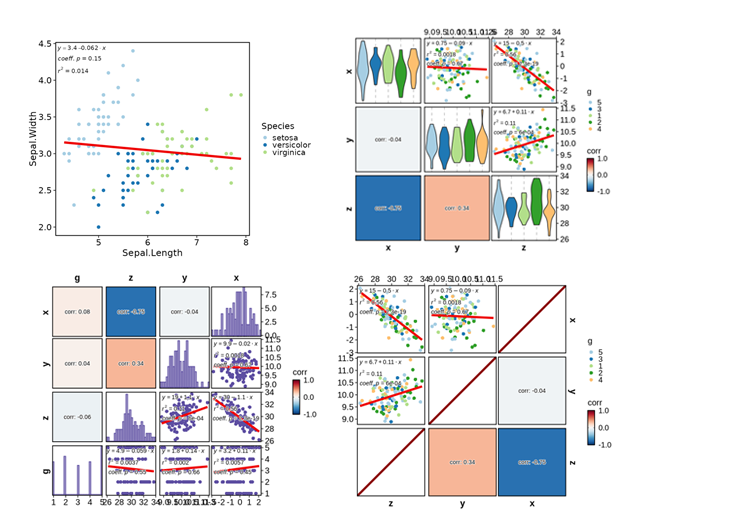
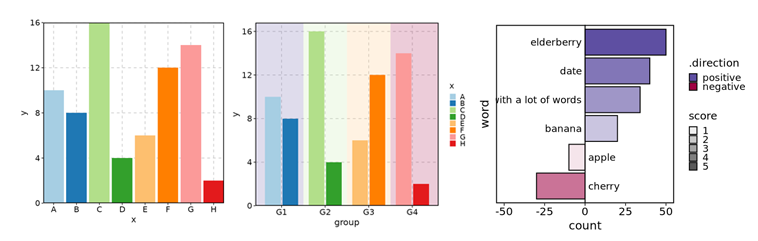
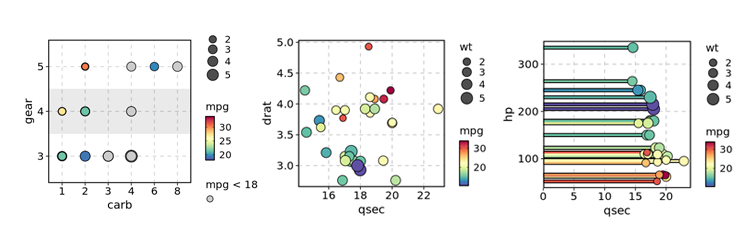
DotPlot
/ ScatterPlot
/ LollipopPlot
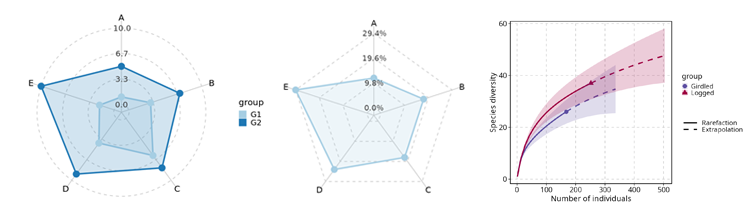
RadarPlot
/ SpiderPlot
/ RarefactionPlot
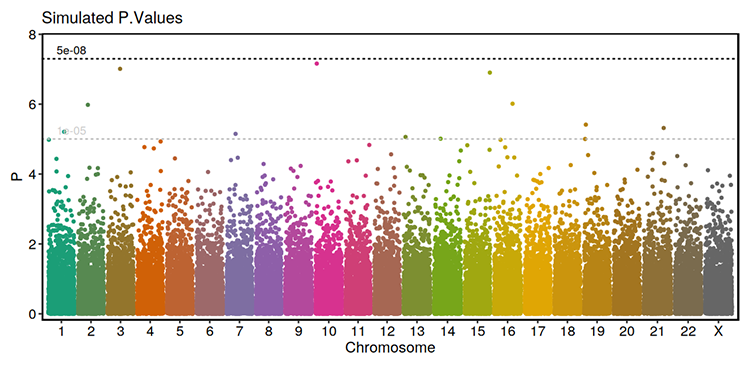
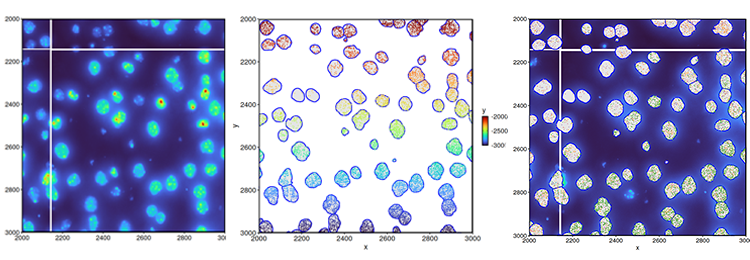
SpatImagePlot
/ SpatMasksPlot
/ SpatShapesPlot
/ SpatPointsPlot
plotthis is greatly inspired by the SCP
package, but with the plotting functions detached from the Seurat object
or single-cell data analysis. It is designed to be more flexible and
general-purpose, and can be used for a wide range of data types and
analysis scenarios.
These binaries (installable software) and packages are in development.
They may not be fully stable and should be used with caution. We make no claims about them.