The hardware and bandwidth for this mirror is donated by METANET, the Webhosting and Full Service-Cloud Provider.
If you wish to report a bug, or if you are interested in having us mirror your free-software or open-source project, please feel free to contact us at mirror[@]metanet.ch.
The powergrid package is intended to allow users to easily evaluate a function across a grid of input parameters. The utilities in the package are aimed at performing analyses of power and sample size, allowing for easy search of minimum n (or min/max of any other parameter) to achieve a minimal level of power (or a maximum of any value). Also, plotting functions are included that present the dependency of n and power in relation to further parameters.
Note that the package is currently in a late stage of development.
You are encouraged to use the package released here on SCTO’s github.
For replicability, make sure you explicitly refer to the current release
when loading the package in your code, using argument tag
to install_github.
devtools::install_github("SwissClinicalTrialOrganisation/powergrid",
                         build_vignette = TRUE)
library(powergrid)
Powergrid is a package mainly developed by Gilles Dutilh, partly funded by a Statistical programming grant from the SCTO. Valuable contributions have been made by Richard Allen of the statistics team at DKF basel.
Define a grid of parameters to evaluate a function across:
sse_pars <- list( # a simple list
  n = seq(from = 10, to = 60, by = 5), # sample size
  sd = seq(from = 0.1, to = 1, by = 0.1) # standard deviation
)
Define a function to evaluate the parameters across the grid. The
function should take the parameters as input and return a single value
(e.g., power, sample size, etc.). For example, we can use the
power.t.test function from the stats package
to calculate power for a t-test:
PowFun <- function(n, sd){
  ptt = power.t.test(n = n/2,
                     delta = .6,
                     sd = sd,
                     sig.level = 0.05)
  return(ptt$power)
}
Evaluate the function at each grid node:
power <- PowerGrid(pars = sse_pars, fun = PowFun)Display the results:
PowerPlot(power)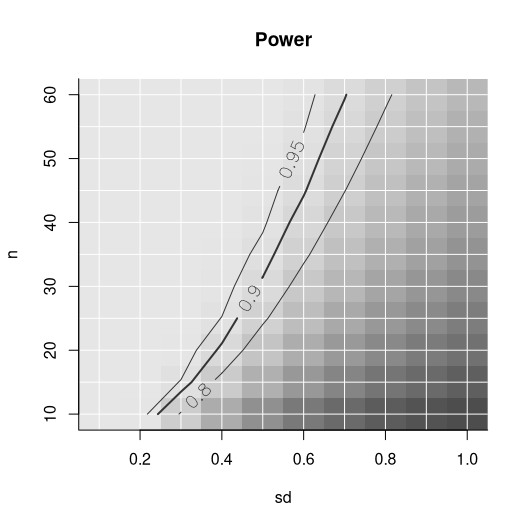
See the vignette for more details on how to use the package and its functions.
Please don’t hesitate making an issue above or contributing through a pull request. You may also contact Gilles by email.
These binaries (installable software) and packages are in development.
They may not be fully stable and should be used with caution. We make no claims about them.