The hardware and bandwidth for this mirror is donated by METANET, the Webhosting and Full Service-Cloud Provider.
If you wish to report a bug, or if you are interested in having us mirror your free-software or open-source project, please feel free to contact us at mirror[@]metanet.ch.

qualpalr generates distinct qualitative color palettes,
primarily for use in R graphics. Given n (the number of
colors to generate), along with a subset in the hsl color space (a
cylindrical representation of the RGB color space) qualpalr
attempts to find the n colors in the provided color
subspace that maximize the smallest pairwise color difference.
This is done by projecting the color subset from the HSL color space to
the DIN99d space. DIN99d is (approximately) perceptually uniform, that
is, the euclidean distance between two colors in the space is
proportional to their perceived difference.
qualpalr was inspired by i want hue.
Let’s create a palette of 4 colors of hues from 0 to 360, saturation between 0.1 and 0.5, and lightness from 0.6 to 0.85.
library(qualpalr)

pal <- qualpal(n = 4, list(h = c(0, 360), s = c(0.1, 0.5), l = c(0.6, 0.85)))
We can retrieve the generated colors in hex format
pal$hex
#> [1] "#cd836c" "#9468c9" "#81cbd4" "#c7ca71"
Alternatively, we can create a palette using one of the predefined color subspaces and, optionally, adapt it to color deficiency (here deuteranomaly).
pal2 <- qualpal(
  n = 4,
  cvd = c(deutan = 0.5)
)
#> The argument 'cvd_severity' is deprecated and will be
#>       removed in a future version. Please use a named 'cvd' object instead.
We can look at a distance matrix of the pairwise color differences from the palette we have generated.
pal2$de_DIN99d
#>          #6d6cc9  #e8bbe5  #cb7469
#> #e8bbe5 18.55197
#> #cb7469 23.07448 17.62027
#> #d1eac2 27.38009 20.50007 23.00737
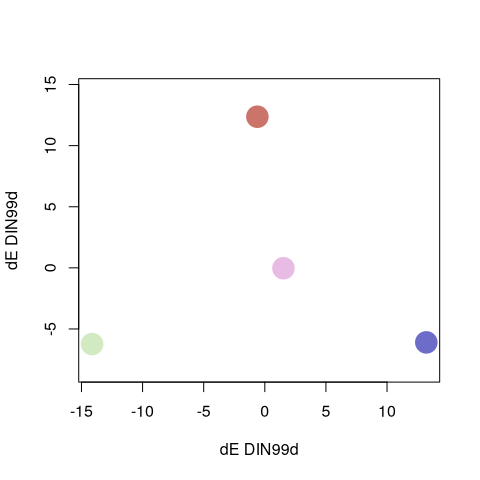
The palette may also be plotted with in a multidimensional scaling plot generated from the distance matrix of the colors in the palette.
plot(pal2)
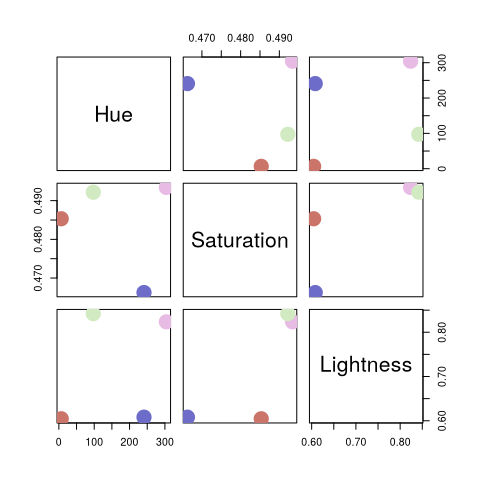
Or it might be plotted in one of the provided color spaces as a scatterplot matrix.
pairs(pal2, colorspace = "HSL")
The current CRAN release can be installed by running
install.packages("qualpalr")The development version can be installed by running
pak::pkg_install("jolars/qualpalr")Versioning is based on semantic versioning.
Please note that this project is released with a Contributor Code of Conduct. By participating in this project you agree to abide by its terms.
qualpalr is open source software, licensed under GPL-3.
These binaries (installable software) and packages are in development.
They may not be fully stable and should be used with caution. We make no claims about them.