The hardware and bandwidth for this mirror is donated by METANET, the Webhosting and Full Service-Cloud Provider.
If you wish to report a bug, or if you are interested in having us mirror your free-software or open-source project, please feel free to contact us at mirror[@]metanet.ch.

Chiefeng Chen, Enoch Kang, Wen-Hsuan Hou, Jin-Hua Chen, Yu-Chieh Chuang, &
Edwin
Chan
Package rankinma supports users to easily obtain and visualize various metrics of treatment ranking from network meta-analysis without major concerns regarding heterogeneity, intransitivity, and incoherence. This package not only accepts manual-prepared data set of treatment ranking metrics from users, but also can help users to gather various treatment ranking metrics in network meta-analysis.
rankinma allows users to visualize various treatment ranking metrics in network meta-analysis based either common-effect model or random-effects model no matter using frequentist or Bayesian approach. The current version includes three common metrics of treatment ranking.
Briefly, rankinma can be used for visualization of both detailed metrics of probabilities and global metrics (i.e. SUCRA and P-score). Besides, rankinma provides users multiple types of plots to illustrate aforementioned treatment ranking metrics, and current version consists of five types of plots with six sub-types.
Package rankinma has been formally released on the CRAN, and users can install rankinma in R using following syntax:
install.packages("rankinma")If users have tabulated global metrics of treatment ranking in a csv file, they can illustrate beading plot without installation of package rankinma by using online platform RankiNMA (click here).
To depict global metrics of treatment ranking using bar chart:

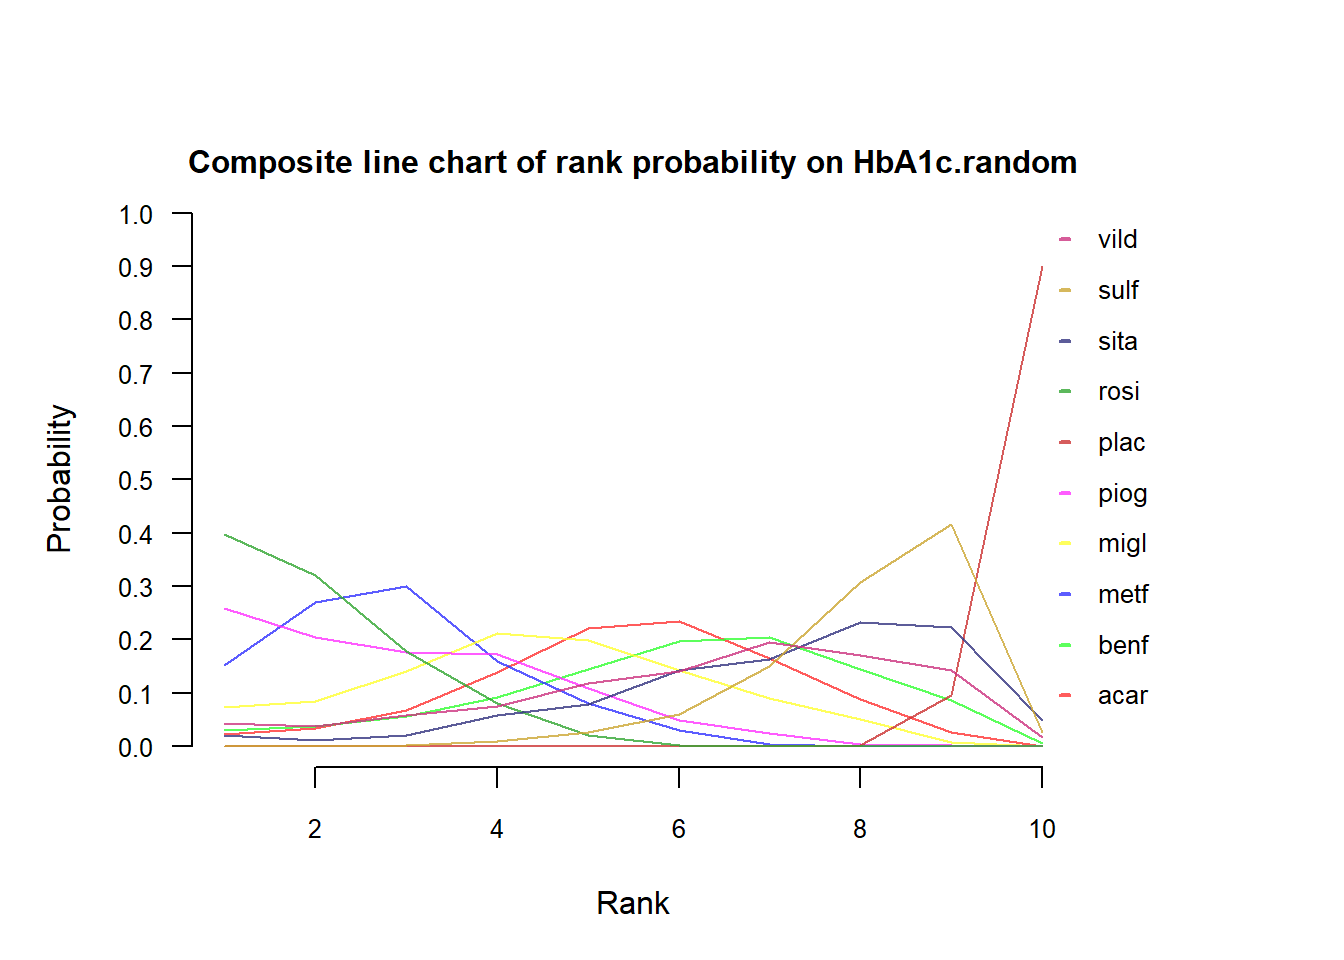
To depict probabilities of treatments on each possible rank using multi-line chart:

To depict probabilities of treatments on each possible rank using stacked bar chart:

To depict global metrics of treatment ranking using beading plot:

This package is mainly written according to Google’s R style. For readers, details of naming rules are listed as follows:
.R file is named using lower case with underscore “_” between words (e.g. get_metrics.R).
function is named using verb or verb with noun,
and the first character of each word is written in capital letter
(e.g. GetMetrics()).
object is named using noun with the first word
in lower case, but the first character of rest words is written using
capital letter (e.g. dataBeads).
variable is named using noun written in lower
case. Words of variable name are separated by “.” if a variable name
consists of more than two words
(e.g. dataRankinma$metrics.name).
Version number consists of three integers with a period between them (eg. version 1.0.0).
Updating the first integer refers to a modification with new methodological impact.
Changing the second integer refers to an update with a new function without new methodological impact.
Updating the third integer refers to a modification in a function.
This package is licensed under the GPL-3 License.
Task force will keep update package rankinma for following issues:
These binaries (installable software) and packages are in development.
They may not be fully stable and should be used with caution. We make no claims about them.